Worldwide Administrative and Zip Code Boundaries
Enterprise-ready boundary data with edge-matched polygons covering 247 countries.


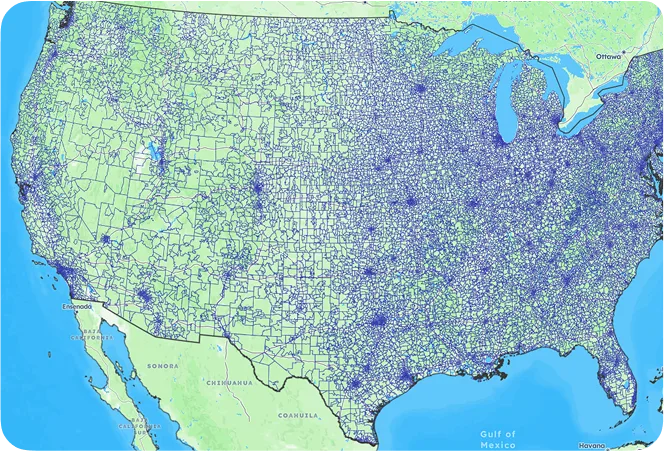
United States
Boundary Database
Coverage
| Country | Postal Codes | Regions | Cities | Admin Levels |
|---|---|---|---|---|
| United States | 41,353 | 3,197 | 53,436 | 2 |
| United Kingdom | 1,791,707 | 402 | 32,061 | 4 |
| Germany | 26,336 | 4,723 | 13,101 | 4 |
| France | 16,050 | 35,232 | 39,597 | 4 |
| Canada | 898,855 | 326 | 8,350 | 2 |
| Australia | 2,949 | 574 | 16,192 | 2 |
From shipping optimization to market analysis, our boundary data powers countless solutions.


See how organizations leverage our boundary data to drive critical business decisions
“Having postal boundary visualizations works much better for customers than putting things on a table. We know that geographic data can change over time. It’s good to know that GeoPostcodes is keeping on top of those changes.”

“While using publicly available data, we realized that data coverage and quality issues were holding us back. GeoPostcodes data has made a huge difference in our ability to reliably geocode and resolve addresses.”

“GeoPostcodes allows us to confidently and accurately map zip codes to natural hazard event boundaries. Incorporating their high-quality boundaries had a great impact on our risk intelligence software.”

“I’ve really enjoyed working with the GeoPostcodes team. Whenever we have a problem, we come up with a solution together. They’ve come up with several features in response to our needs.”

“GeoPostcodes’ customer success is top- notch. Our CSM has helped us a lot through our integration process, and she has been quick to answer all our inquiries. She also makes sure we get the most value out of their postal data.”

“We really appreciate that GeoPostcodes
provides comprehensive data for all
relevant countries out of one data source.”

Join hundreds of enterprise clients who trust GeoPostcodes for their location intelligence needs
Comprehensive, accurate, and always up-to-date polygons for ZIP codes
and administrative levels worldwide

Our proprietary topological model ensures shape accuracy. No gaps, no overlaps, no duplicate data.

ZIP code and administrative boundary data across 247 countries, including complex geographies.

Accurate mapping of the world at every level, up to 1-meter precision.

Request a personalized quote
Interested in the full database? Ask for a quote.
Our pricing model depends on a few factors such as products, features, use case and country coverage.
Get in touch to receive an accurate pricing proposal.
Annual licenses are priced based on the number of countries needed, type of usage, products and the features (additional datasets).
Our licenses have a fixed price and include everything: comprehensive location data, unlimited updates, the right to use our data in all your systems or products, and continuous support from a dedicated expert.
Data is updated weekly, but you can decide on your own update frequency depending on your use case. You can get automatic differential updates and a list of historical ID changes by using our download API.
124 of the Fortune 500 rely on our international data
Frequently Asked Questions
Admin-0 boundaries are the broadest and most fundamental administrative units in a geospatial data hierarchy. They define a country’s borders, marking its sovereignty’s limits.
Our boundary database ensures accuracy between polygons and between layers thanks to our topological model. All our data sets are updated frequently to ensure you get access to the most recent version of the geospatial data. Our outstanding quality comes from more than 10 years of double-checking and cross-referencing official sources.
Our boundary files come in 4 data sets formats (KML, GeoJSON, Shapefiles and Topojson). They can be easily integrated into your platform of choice. Our team will guide your integration process to ensure you get the most accurate spatial data analysis and map visualizations.
Our boundaries data is updated weekly to reflect any changes in postal codes or geographical areas. This ensures you always have the most current information for accurate planning and analysis.
Yes, our data is compatible with various GIS applications and can be overlaid on map tiles. This allows you to view detailed boundaries within your preferred mapping tools for enhanced visual representation.
We offer a public demo that lets you view sample data to evaluate its quality and compatibility with your needs. This gives you a firsthand look before committing.
We provide regular updates to account for any changes in boundaries. You’ll receive these updates regularly.