
Key takeaways
- Metropolitan Statistical Areas (MSAs) define America’s economic regions beyond political boundaries.
- The top 10 metropolitan areas house over 85 million people, driving the national GDP.
- Sunbelt metropolitan areas like Austin and Orlando lead with 2-3% annual growth rates.
- Metro areas can span multiple counties and states, varying in size and population density.
Introduction to Metropolitan Statistical Area
When you examine how Americans live and work, the traditional map of states and cities tells only part of the story. The real economic and social fabric of the United States is woven through Metropolitan Statistical Areas (MSAs) and Micropolitan Statistical Areas, collectively known as Core Based Statistical Areas (CBSAs).
In this article, we will explore Metropolitan Statistical Areas—their definition, economic impact, and their unceasing development.
First, to give you a visual idea of MSA, let’s start with a map of the United States of America and Puerto Rico, on which you will see the territories divided by a number of green squares. Each small, dense green square that crosses a city’s political boundaries is a Metropolitan Statistical Area.
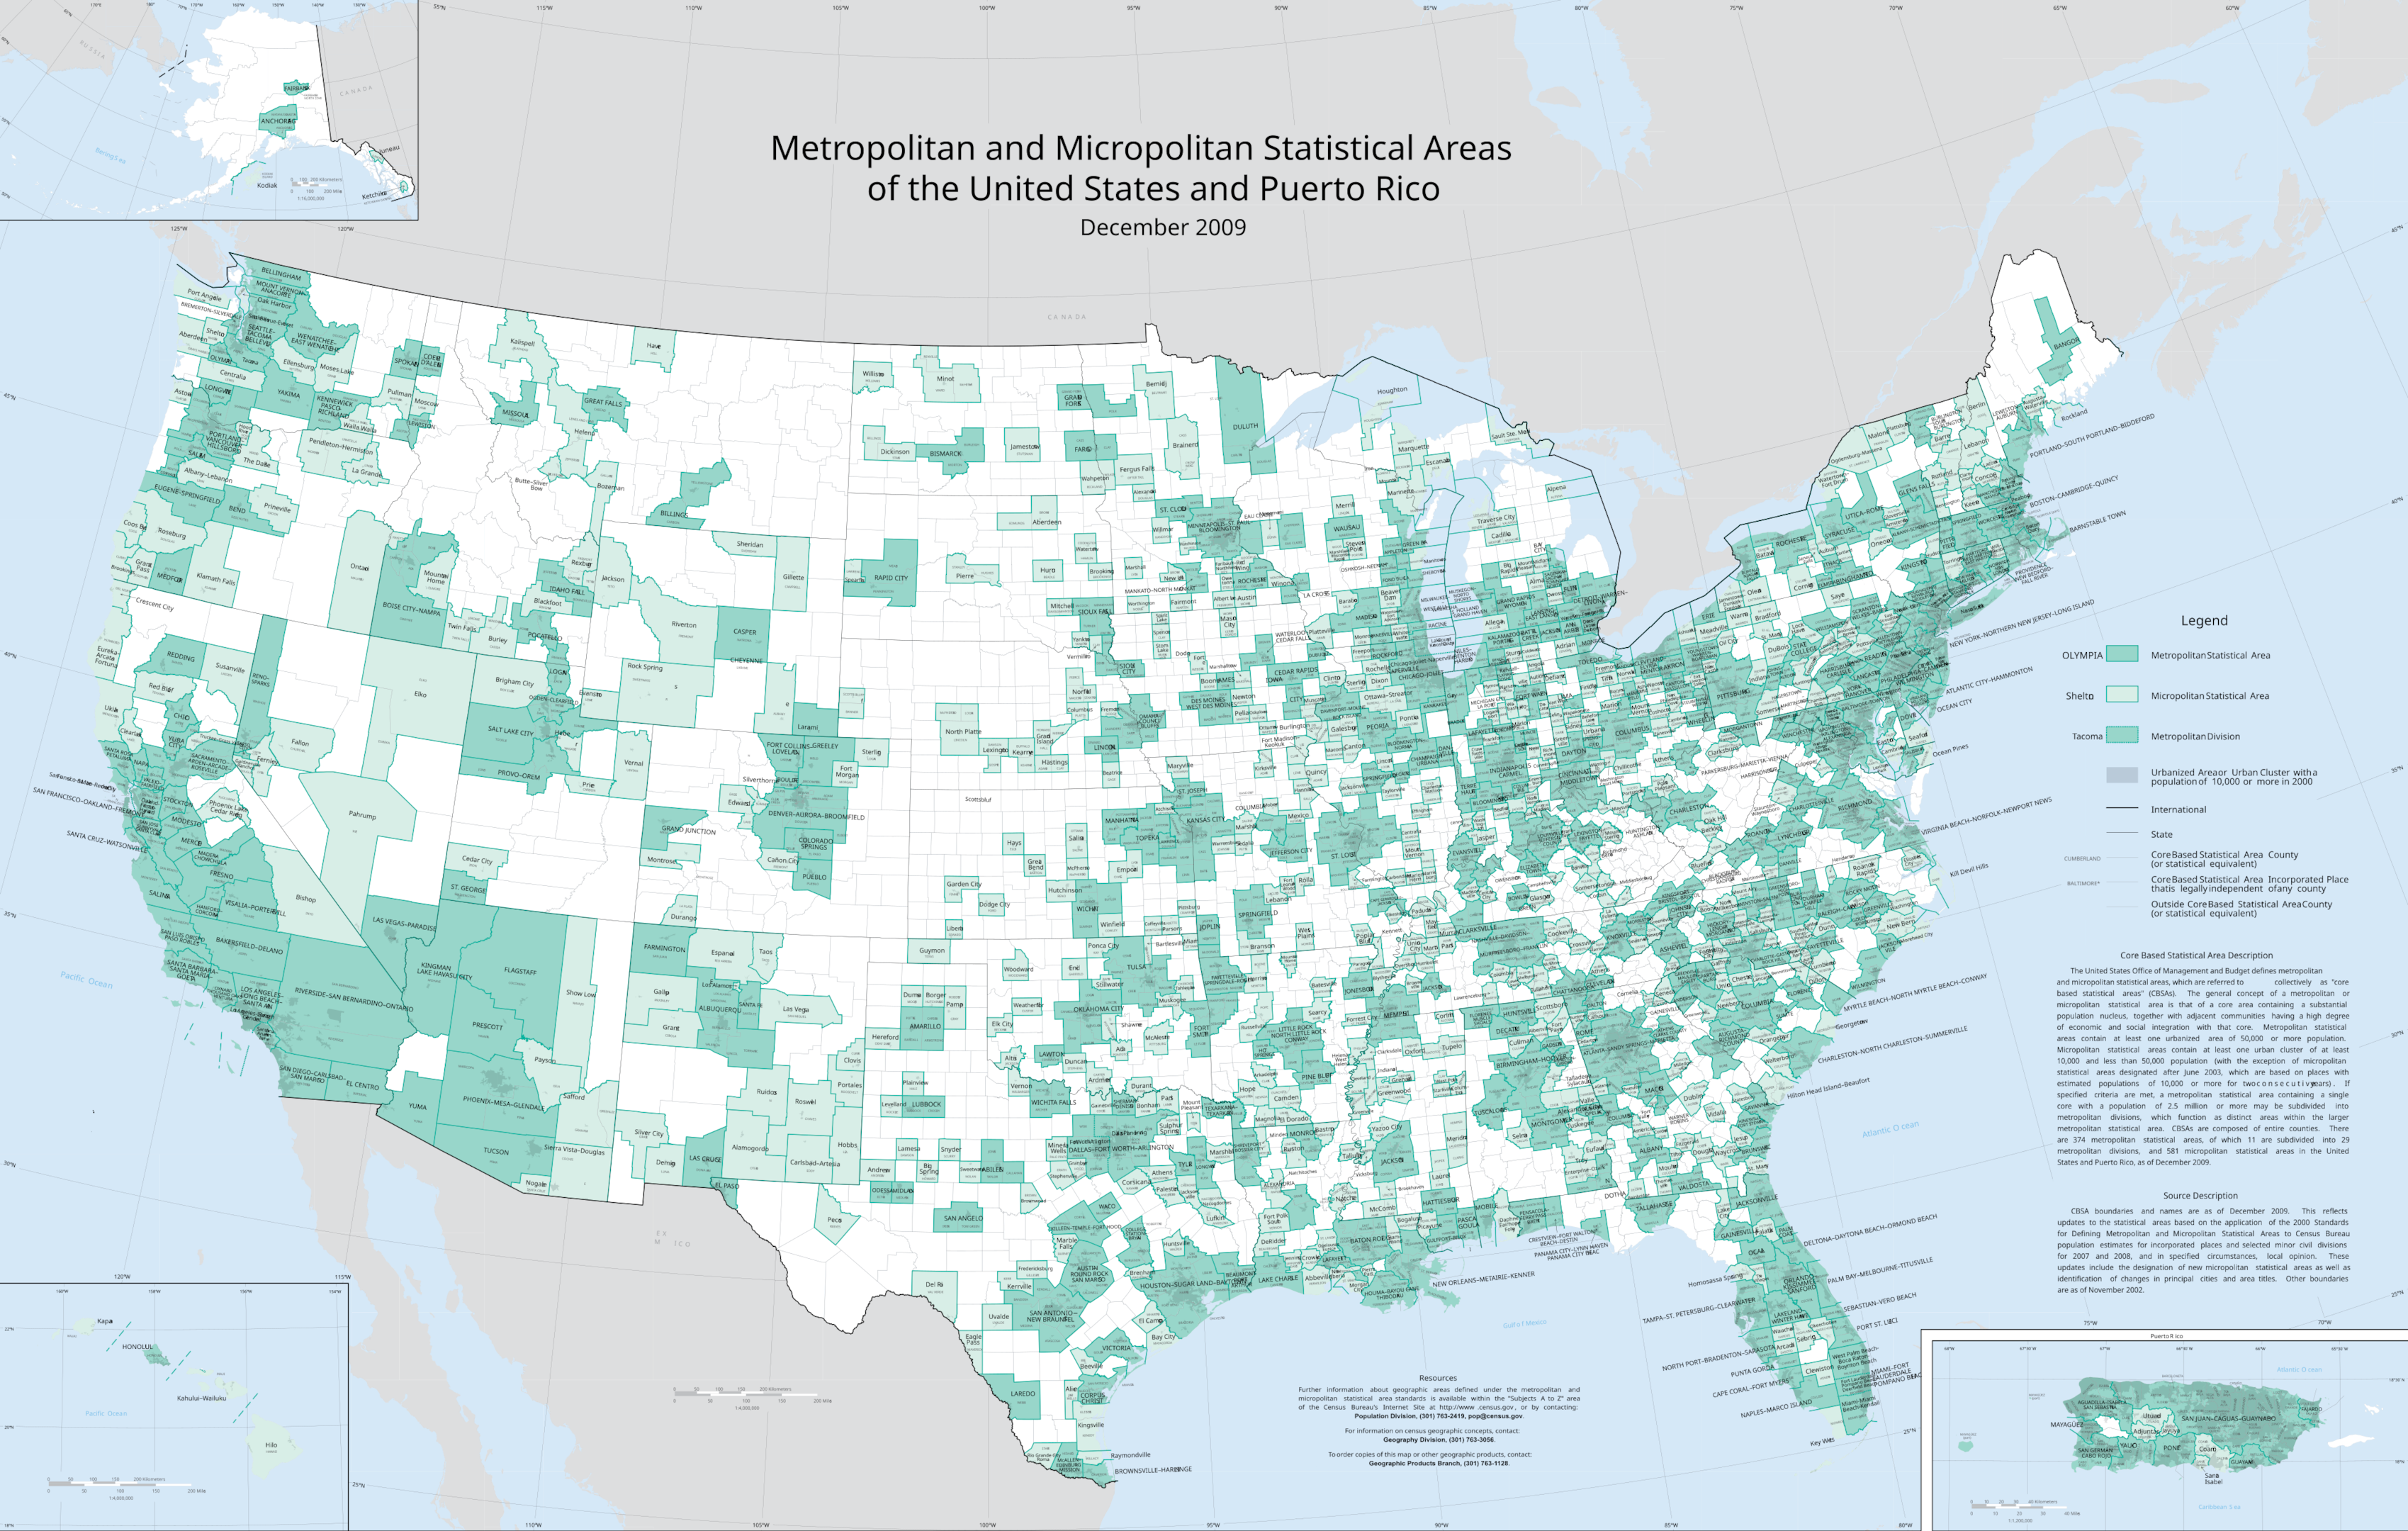
These clusters of interconnected communities show how people move, where they work, and how regional economies function. They are America’s way of acknowledging that their social lives spill well beyond city limits.
The Office of Management and Budget defines these areas as regions built around cities with at least 50,000 people, including nearby counties that are closely connected through commuting and economic activity.
With over 80% of Americans now living in urban areas, understanding metropolitan structure is essential. Whether planning logistics, targeting customers, or scaling operations, accurate MSA data gives you the strategic edge.
💡 Browse GeoPostcode’s population dataset, built from authoritative census sources and our proprietary boundaries database. Enhance your territory mapping and marketing analysis with zip code-level population data. You can download a free sample here.
Largest Metro Areas in the U.S.
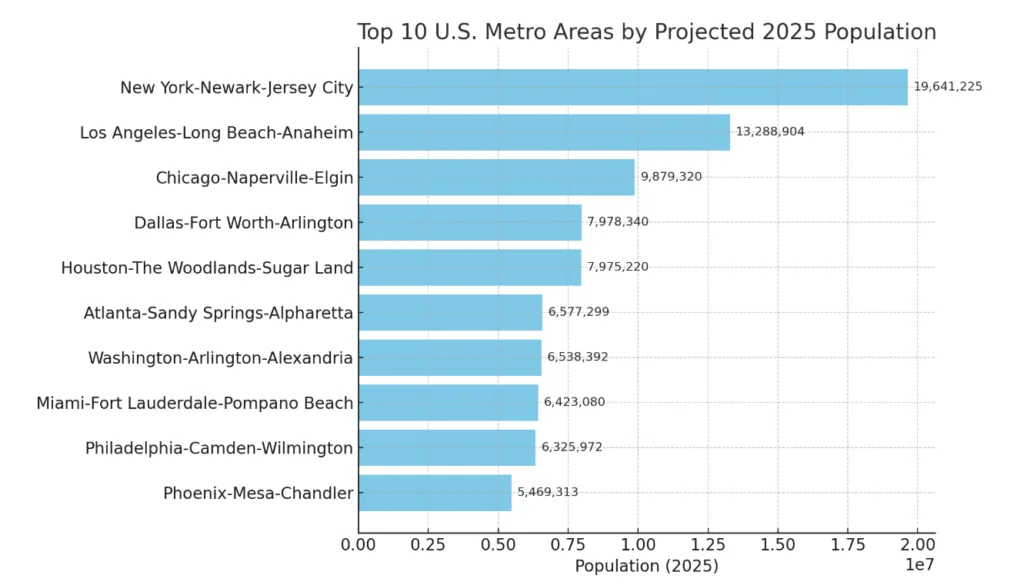
When you look at how people are spread out across the U.S., a huge chunk of the population is clustered around a few major metro areas. According to GeoPostcodes’ population data, here are the 30 biggest metropolitan areas in the country by population:
| Rank | metropolitan area | population (2025) | states |
|---|---|---|---|
| 1 | New York-Newark-Jersey City | 19,641,225 | NY-NJ-PA |
| 2 | Los Angeles-Long Beach-Anaheim | 13,288,904 | CA |
| 3 | Chicago-Naperville-Elgin | 9,879,320 | IL-IN-WI |
| 4 | Dallas-Fort Worth-Arlington | 7,978,340 | TX |
| 5 | Houston-The Woodlands-Sugar Land | 7,975,220 | TX |
| 6 | Atlanta-Sandy Springs-Alpharetta | 6,577,299 | GA |
| 7 | Washington-Arlington-Alexandria | 6,538,392 | DC-VA-MD-WV |
| 8 | Miami-Fort Lauderdale-Pompano Beach | 6,423,080 | FL |
| 9 | Philadelphia-Camden-Wilmington | 6,325,972 | PA-NJ-DE-MD |
| 10 | Phoenix-Mesa-Chandler | 5,469,313 | AZ |
| 11 | Riverside-San Bernardino-Ontario | 5,137,831 | CA |
| 12 | Boston-Cambridge-Newton | 4,886,137 | MA-NH |
| 13 | San Francisco-Oakland-Berkeley | 4,550,629 | CA |
| 14 | Detroit-Warren-Dearborn | 4,179,716 | MI |
| 15 | Seattle-Tacoma-Bellevue | 4,051,726 | WA |
| 16 | Minneapolis-St. Paul-Bloomington | 3,722,624 | MN-WI |
| 17 | San Diego-Chula Vista-Carlsbad | 3,530,341 | CA |
| 18 | Tampa-St. Petersburg-Clearwater | 3,348,027 | FL |
| 19 | Denver-Aurora-Lakewood | 3,088,903 | CO |
| 20 | San Antonio-New Braunfels | 2,898,825 | TX |
| 21 | St. Louis | 2,883,091 | MO-IL |
| 22 | Baltimore-Columbia-Towson | 2,866,842 | MD |
| 23 | Orlando-Kissimmee-Sanford | 2,739,553 | FL |
| 24 | Charlotte-Concord-Gastonia | 2,712,935 | NC-SC |
| 25 | Las Vegas-Henderson-Paradise | 2,697,683 | NV |
| 26 | Portland-Vancouver-Hillsboro | 2,684,165 | OR-WA |
| 27 | Austin-Round Rock-Georgetown | 2,666,215 | TX |
| 28 | Sacramento-Roseville-Folsom | 2,646,821 | CA |
| 29 | Columbus | 2,306,564 | OH |
| 30 | Pittsburgh | 2,303,068 | PA |
Among them, the top 10 metro areas house 85.7 million people, 57.8% of the top 30 metro population and over a quarter of the U.S. population. But size isn’t the whole story. These regions span counties, cities, and even state lines, forming patchwork quilts of overlapping jurisdictions that shape how they function.
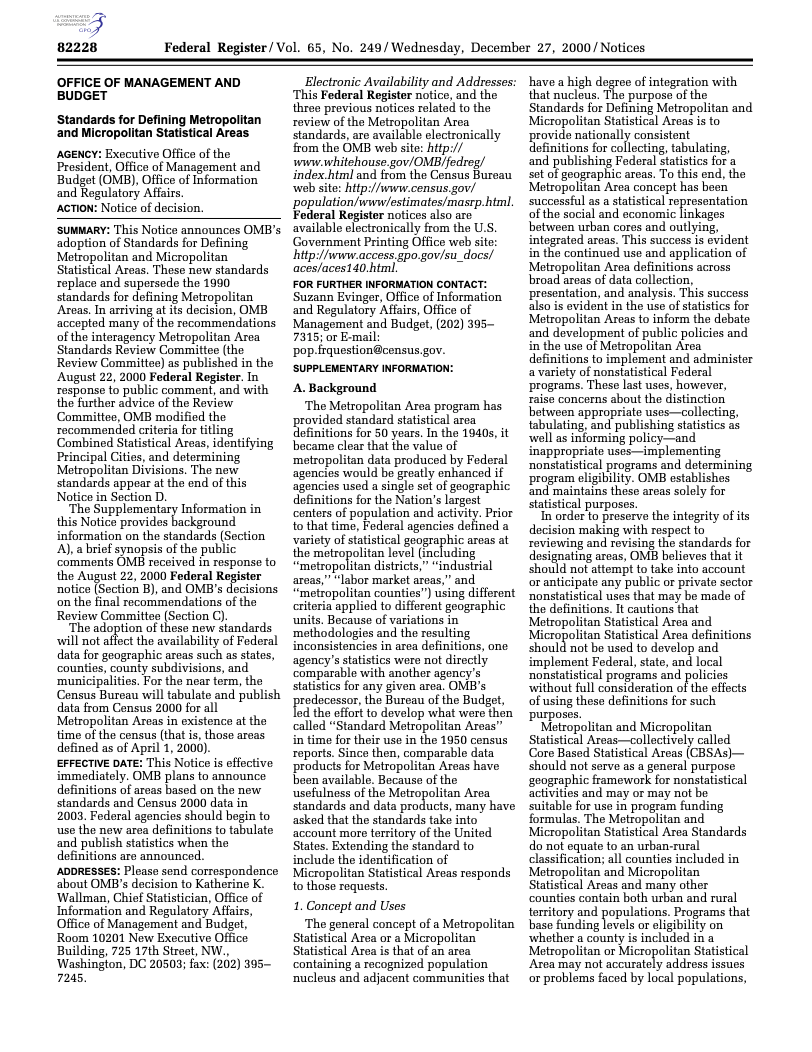
The Office of Management and Budget regularly updates metropolitan area definitions to reflect the latest trends in population, commuting patterns, and economic integration. This formal process is documented through official Federal Register notices, such as the one shown below from December 2000, which established the current standards for defining Metropolitan and Micropolitan Statistical Areas that continue to guide the classification of these regions today.
Economic Importance of Metro Areas
Metropolitan areas are America’s economic powerhouses. These urban ecosystems generate most of the U.S. GDP and attract talent, investment, and opportunities. With dense populations and businesses, they fuel innovation, specialization, and productivity at unmatched levels.
The numbers tell a compelling story. The population densities in New York and Los Angeles create marketplaces with purchasing power and specialized demand.
Consider Washington-Arlington-Alexandria, where public sector spending seeded an entire universe of specialized contractors, consultants, and service providers. The government is the sun, and thousands of private companies orbit around it, creating resilience and opportunity beyond federal budgets.
Or look at Atlanta-Sandy Springs-Alpharetta, where strategic transportation infrastructure turned a regional crossroads into a corporate headquarters hub. The region leveraged its geographic advantages into an environment where businesses could efficiently connect to national and global markets.
For international business strategy, it’s fundamental to understand these metropolitan economic engines to capture America’s market potential.
Fastest-Growing Metro Areas
While New York and Los Angeles might dominate the headlines, America’s economic story is being dramatically rewritten in the Sunbelt. These high-growth metro areas are redefining what American business looks like in the 21st century.
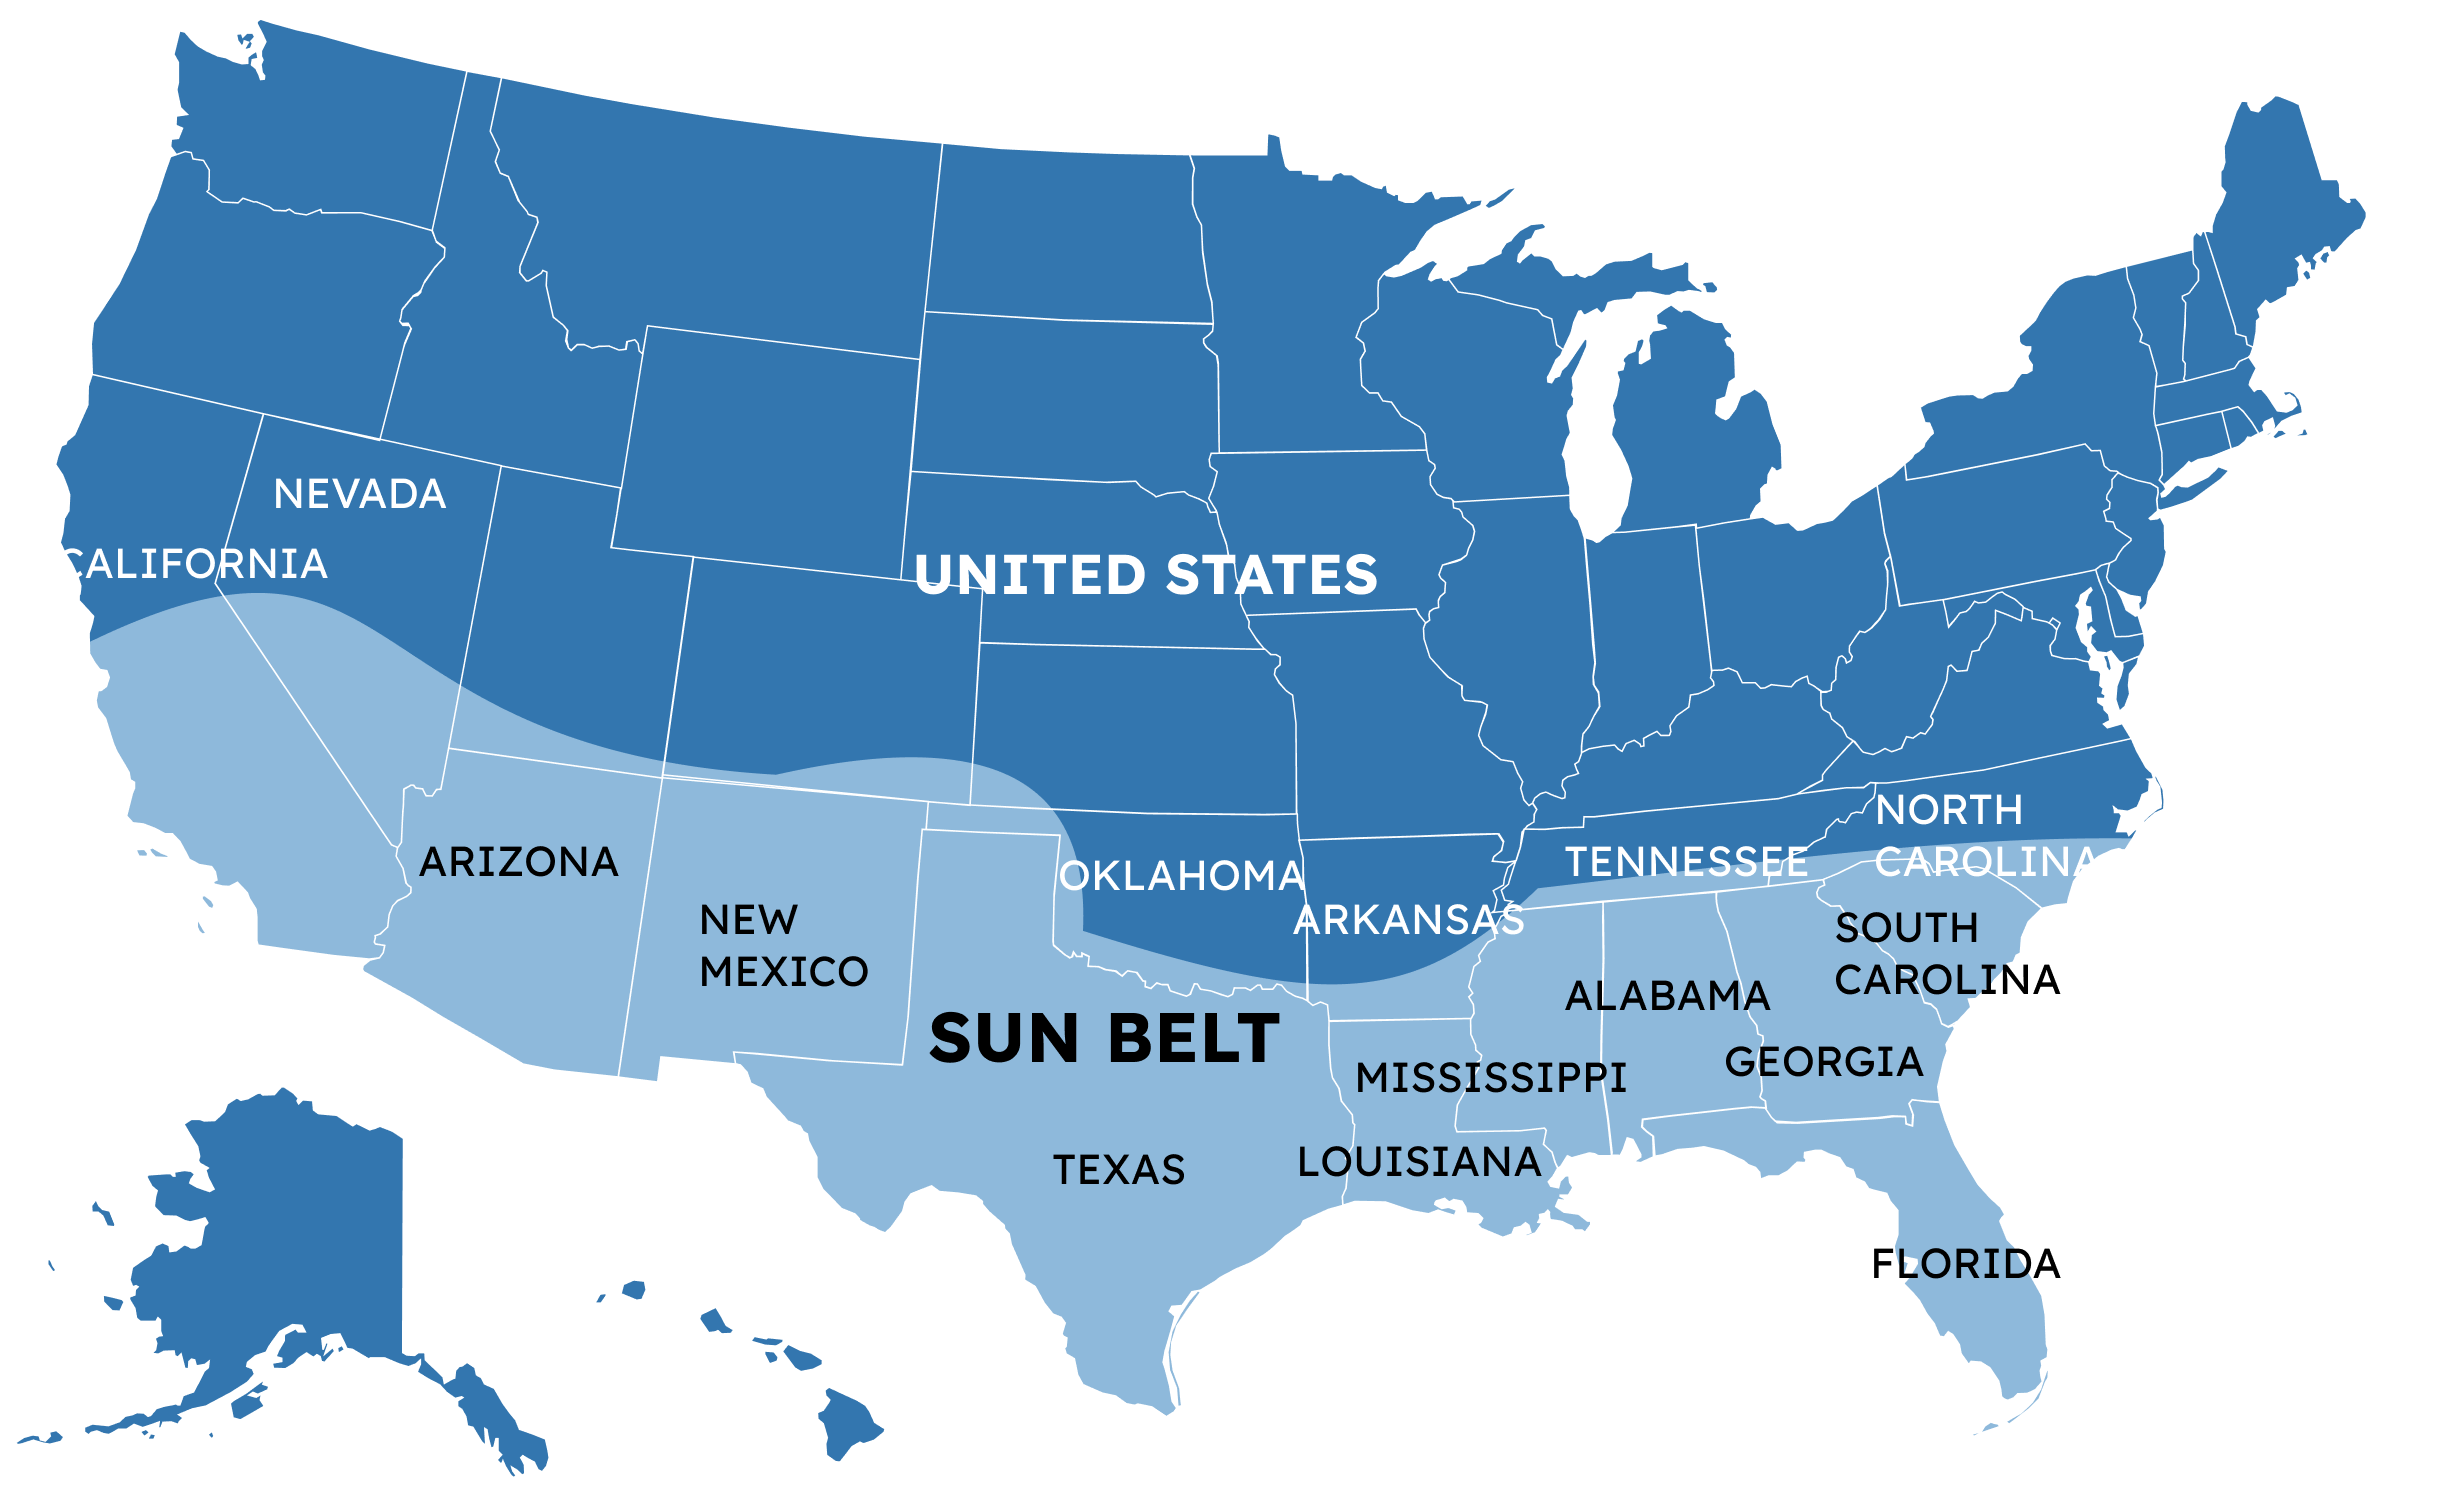
Based on the U.S. Census Bureau Population Estimates Program (2020-2024), these are the Sunbelt boom leaders:
| METRO AREA | GROWTH RATE (2020-2024) | NEW RESIDENTS ADDED | ANNUAL GROWTH RATE |
|---|---|---|---|
| Austin-Round Rock-Georgetown, TX | 7.53% (2020–2023) | 173,000+ | 2.1% |
| Orlando-Kissimmee-Sanford, FL | 13% (2020–2024) | 267,126 | 2.7% |
| Phoenix-Mesa-Chandler, AZ | 4% (2020–2023) | 195,000 | 1% |
| Tampa-St. Petersburg-Clearwater, FL | 7% (2020–2024) | 53,836 | 1.3% |
What’s behind this Sunbelt boom? Warmer climates, lower living costs, manufacturing expansion, and new opportunities in technology, healthcare, and services are reshaping America’s demographic and economic map.
Demographic Characteristics and Challenges
America’s metro areas aren’t just big or small—they each have their own unique vibe. Some attract young professionals, others retirees, shaping how people shop and how businesses hire.
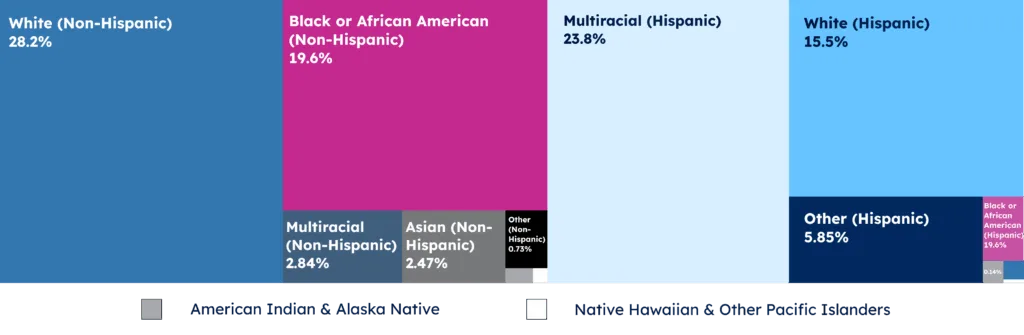
The Miami–Fort Lauderdale–Pompano Beach metro is a great example. It’s a vibrant crossroads where Latin American and Caribbean influences shape everything, from how people connect to how business gets done. It’s a unique ecosystem with its own rhythm and rules.
On the flip side, the Minneapolis–St. Paul–Bloomington metro has carved out a name for itself with a well-educated population—more college degrees here than the national average. That’s a big draw for companies in healthcare, finance, and tech looking for top-tier talent.

But even the most dynamic metros face growing pains—rising populations, housing costs, transit strain, and aging infrastructure. These issues cross city lines, demanding regional coordination and creative solutions.
Beyond Population: Metro Area Size
While population size captures attention, geographic scale reveals different metro characteristics.
Some of the largest metros by land aren’t the most crowded. For example, the Riverside–San Bernardino–Ontario area in California spans over 70,000 km², the largest by area but only the 12th most populous. Phoenix–Mesa–Scottsdale spans nearly 38,000 km², second in area, with Albuquerque, Dallas–Fort Worth, and Tucson close behind.
Compare them to New York—the most populated metro, but only eighth in size at 21,500 km². Its density brings unique challenges: complex addresses, strained postal routes, and tough logistics for location-based businesses. The gap between population and land size leads to major differences in density, affecting infrastructure, transit, and planning.
Conclusion
As urbanization accelerates, the influence of metropolitan areas grows, fueled by industries like technology, healthcare, and e-commerce. It’s a promising path, but not without hurdles.
Growth brings challenges like housing costs, transit strain, environmental pressure, and the need for equitable development. Addressing them requires smart planning and a clear grasp of how these regions work.
For global businesses, understanding metropolitan dynamics is crucial for market analysis, customer targeting, and operational planning. Accurate location data helps companies navigate the complex geography of America’s urban landscape, and services like GeoPostcodes make that possible.
We invite you to browse our data for free to explore how GeoPostcodes‘ comprehensive and always up-to-date datasets can help you navigate the complex patchwork of jurisdictions, postal codes, and constantly shifting boundaries. Download a free sample here and reach out with any questions.
FAQ
What is the largest metro area in the U.S.?
New York-Newark-Jersey City is one of the biggest metro areas in US, with a combined population of nearly 20 million Americans living in the city and suburbs.
What are the 20 largest world metropolitan areas by population?
Based on the UN World Urbanization Prospects data, the 20 most populous metropolitan areas are the following:
| Metropolitan Area |
|---|
| Tokyo |
| Delhi |
| Shanghai |
| Dhaka |
| Cairo |
| São Paulo |
| Mexico City |
| Beijing |
| Mumbai |
| New York-Newark |
| Osaka |
| Kolkata |
| Karachi |
| Chongqing |
| Istanbul |
| Buenos Aires |
| Lagos |
| Los Angeles |
| Manila |
| Rio de Janeiro |
What is the richest metropolitan area in the U.S.?
University research shows that the San Jose-Sunnyvale-Santa Clara metropolitan area is the only metro area ranking as the wealthiest in the US based on per capita income, surpassing even New York State in the Northeast in wealth history. As of 2021, this Silicon Valley region recorded a per capita income of $64,169, reflecting its dominant position in the tech industry.
San Francisco-Oakland-Berkeley follows closely, with both metros thriving thanks to dense tech hubs, venture capital, and high-paying jobs fueling exceptional prosperity.
What is the fastest-growing metro area in the U.S.?
According to the U.S. Census Bureau’s March 2025 release, of the 10 fastest-growing metro areas between 2023 and 2024, nine were in the South, with the two fastest-growing areas (Ocala and Panama City-Panama City Beach)located in Florida.
How do Kansas City and New Haven compare to the biggest metro areas in the U.S.?
While New York remains the biggest metro area, Kansas City and New Haven show surprising growth potential as emerging regional hubs.