
To create a ZIP code map, choose a mapping tool (Mapize, Excel Power Map, or Google My Maps). Prepare your spreadsheet with a reliable ZIP codes database like GeoPostcodes. Upload the data, and the tool will plot your data automatically.
Key takeaways
- ZIP code maps help visualize geographic patterns in data such as sales, customers, or delivery zones.
- To create one, you need ZIP code reference data, a dataset to visualize, and a mapping tool.
- Online tools like Mapize allow you to quickly build interactive maps from spreadsheet data.
- Advanced features, such as proximity radius circles, help analyze distances and service coverage between ZIP codes.
Introduction
ZIP code maps are widely used to visualize location-based data such as sales performance, customer distribution, delivery zones, or market coverage.
Instead of analyzing spreadsheets with thousands of addresses, mapping data by ZIP code allows you to spot geographic patterns quickly, for example, where customers are concentrated, where competitors operate, or which areas remain underserved. Visualizing location data this way often reveals trends that remain hidden in tabular data.
However, building a reliable ZIP code map requires more than just a mapping tool. You also need accurate reference location data that links ZIP codes to geographic coordinates or boundaries.
Without that foundation, maps can easily become misleading due to missing ZIP codes, inaccurate coordinates, or outdated boundary outlines.
This guide shows how to create a ZIP code map using Microsoft Excel, Google Maps, and Mapize. For more on interactive map apps for ZIP code data, check out our article comparing the top 9 zip code mapping tools.
💡 Use reliable reference data to build accurate ZIP code maps. Browse GeoPostcodes datasets for free and download a sample here.
Challenges of creating a ZIP code map
Creating a ZIP code map sounds simple, but several challenges can affect the accuracy of the final visualization. Most of them relate to data consistency and geographic reference information.
ZIP codes change over time
Postal authorities regularly modify ZIP codes to adapt to population growth, urban expansion, or new delivery routes. New ZIP codes are introduced, existing ones are split, and others are retired.
For organizations that rely on geographic analysis, keeping track of these changes requires continuous monitoring and updates.
Inconsistent geographic reference data
ZIP codes are often stored in different formats depending on the country, data provider, or internal system. Combining these datasets can require significant preprocessing and validation before they can be used for mapping.
Missing or outdated ZIP code coverage
Some datasets may be incomplete or outdated, especially when relying on open or community-maintained sources. Missing ZIP codes or inaccurate coordinates can lead to maps that misrepresent geographic patterns.
For example, logistics companies may calculate delivery zones incorrectly, while marketing teams may misidentify high-demand regions.
💡 Discover ZIP codes and administrative boundaries for 247 countries. We offer the most comprehensive and up-to-date ZIP code data for 247 countries, ensuring precise and reliable information. Browse GeoPostcodes datasets for free and download a sample here.
Open-source data resources to plot ZIP codes and their limitations
Open-source ZIP code datasets can be useful for basic mapping projects, but they often come with limitations related to coverage, consistency, and update frequency.
Below are some commonly used open-source sources for ZIP code data.
OpenStreetMap (OSM)
OpenStreetMap (OSM) is a popular open-source mapping platform where volunteers worldwide contribute to geographic data. This includes data on roads, buildings, and ZIP codes. While OSM is helpful, the data quality can vary.
In cities, coverage is usually great because more users contribute. But in rural or less developed areas, the data might be incomplete or outdated, leading to gaps in ZIP code information.
OpenStreetMap does not always have the most complete and up-to-date ZIP code data. As a result, you could be missing postcodes. Some OpenStreetMap postcodes should be discarded altogether, as they don’t respect the country’s postcode format.
Python Libraries: Pyzipcode and Uszipcode
Pyzipcode and uszipcode are extremely similar in coverage (USA) and features. They include a list of ZIP codes and associated properties, like the town they belong to or coordinates.
The uszipcode library has a few more features and data sources. It also provides two different databases: simple and rich.
The simple database contains basic information about ZIP codes, such as city, state, latitude, longitude, etc. The rich database contains more detailed information, such as population, housing, income, etc.
The uszipcode library also provides a search engine that allows us to query ZIP codes based on various criteria, such as city, state, radius, population, etc.
These are convenient, but the underlying data is a bit blurry: it is unknown when the data is refreshed and which source is used to update it.
Another problem is the inconsistency in data formats across different sources. Countries and organizations often use different geographic and postal data formats, making it tricky to combine and standardize everything. This means that preprocessing and validating the data are essential to creating an effective ZIP code map.
💡 Use accurate data to create a ZIP code map. We offer the most comprehensive and up-to-date international ZIP code data for enterprises. Browse GeoPostcodes datasets for free and download a sample here.
Three methods to create your own custom map
This section covers three popular and easy methods for creating a ZIP code map: using online map creators, leveraging Microsoft Excel, and utilizing Google Maps.
Using online map makers
The easiest way to create a ZIP code map is by using an online map creator. These web-based tools make creating and customizing maps with your specific data simple.
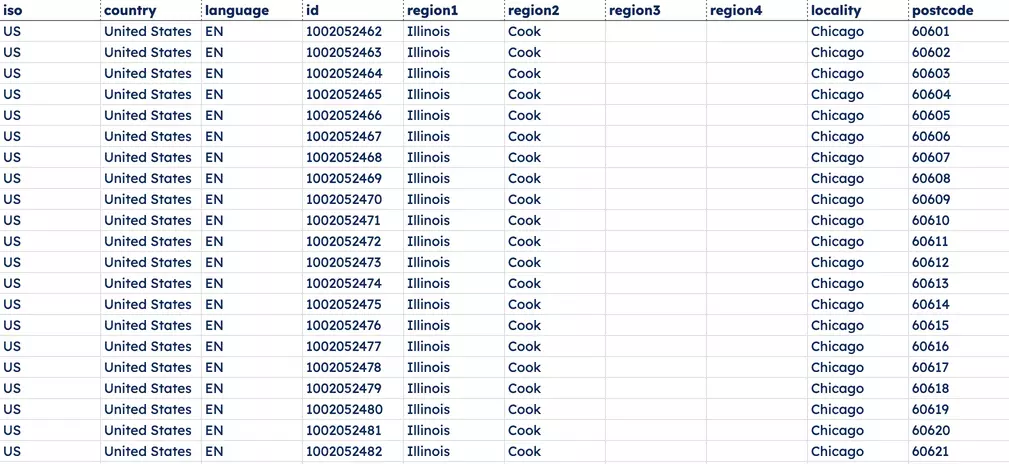
First, make sure your data is accurate and organized in a spreadsheet or a CSV file, with ZIP codes listed in one column. Try a free sample of GeoPostcodes’ up-to-date worldwide ZIP code database for accurate and reliable ZIP code data.
Upload this data to the map maker, which will then automatically plot it on a map based on the ZIP codes.
Next, customize your map’s look and functionality. Change colors, labels, and symbols, or apply filters. You can add extra layers like heat maps, territory boundaries, or markers to make your map more detailed and useful.
Once you’re done, save, share, or export your map in various formats to suit your presentation or analysis needs.
Creating maps in Microsoft Excel
Microsoft Excel is another tool for creating ZIP code maps. It includes a feature known as Power Map, a 3D visualization tool that empowers users to generate interactive maps based on their data. You can create a ZIP code map using the following Microsoft tutorial:
- Open your Microsoft Excel workbook with the data table or Data Model.
- If needed, prepare your data for 3D Maps or download a sample dataset.
- Click any cell in the table.
- Go to Insert > 3D Map. (The first time, this will enable 3D Maps.)
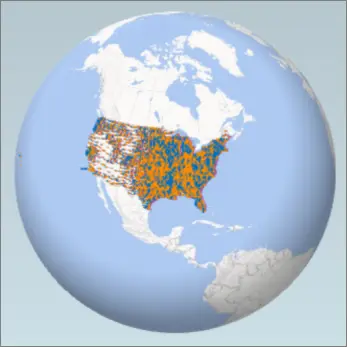
- 3D Maps will use Bing to geocode your data. After a few seconds, a globe appears with the Layer Pane.
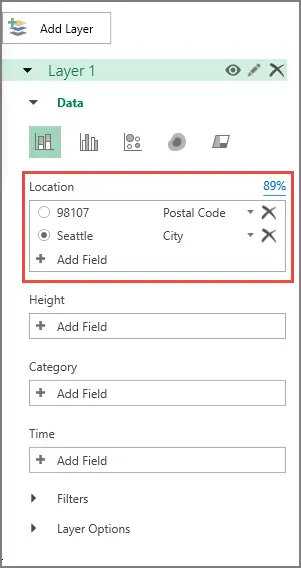
- In the Layer Pane, ensure fields are mapped correctly. Use the drop-down arrows to adjust any incorrectly mapped fields.
- Example: Ensure “Seattle” is recognized as a City and ZIP code as Postal Code.
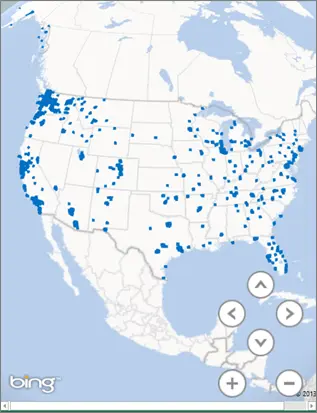
- Dots representing your data will appear on the globe.
Customizing the map’s appearance is easy. Just choose the types, themes, and styles you want. Then, add labels, legends, or titles to enhance it. Additionally, creating different scenes or tours lets you show various aspects of your data.
The final map can be saved, shared, or exported as an image or video, making it useful for different scenarios.
Using Google Maps for mapping multiple ZIP codes
Google Maps, with its all-in-one mapping services, is another effective option for creating zip code maps.
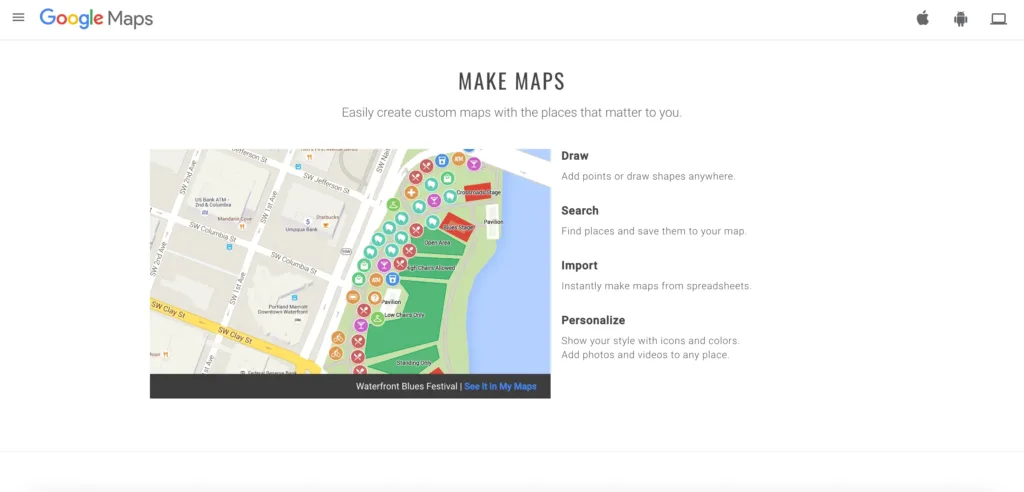
Get your data ready in a spreadsheet or CSV file with zip codes in one column. Import this into Google Maps using the My Maps feature to create a personalized map with markers for each zip code.
Personalise your map by changing marker styles and adding layers, shapes, or directions. Explore it in satellite, terrain, or street view. Save, share, or export your custom map as a KML file or a link, depending on what you need.
There are plenty of tools and methods for making a zip code map with your data. The best option depends on your data, goals, and what you prefer. Up next is a detailed guide on making a zip code map using Mapize, one of the top online map creators.
Detailed guide: Creating a ZIP code map with Mapize
Before diving in, please ensure your dataset is primed in a spreadsheet or a CSV format. This dataset should feature a column dedicated to ZIP codes alongside any other data columns you wish to visualize, such as customer demographics, sales figures, or revenue streams.
💡 Use reliable data to create a ZIP code map. We keep our location data up-to-date, relying on more than 1,500 sources. Browse GeoPostcodes datasets for free and download a sample here.
With your dataset at the ready, follow these steps to actualize your zip code map via Mapize:
- Navigate to the Mapize website and start your mapping journey by signing up for a complimentary account or logging into an existing one.
- Upon entering the dashboard, select “Create a new map” and give your project a name and description.
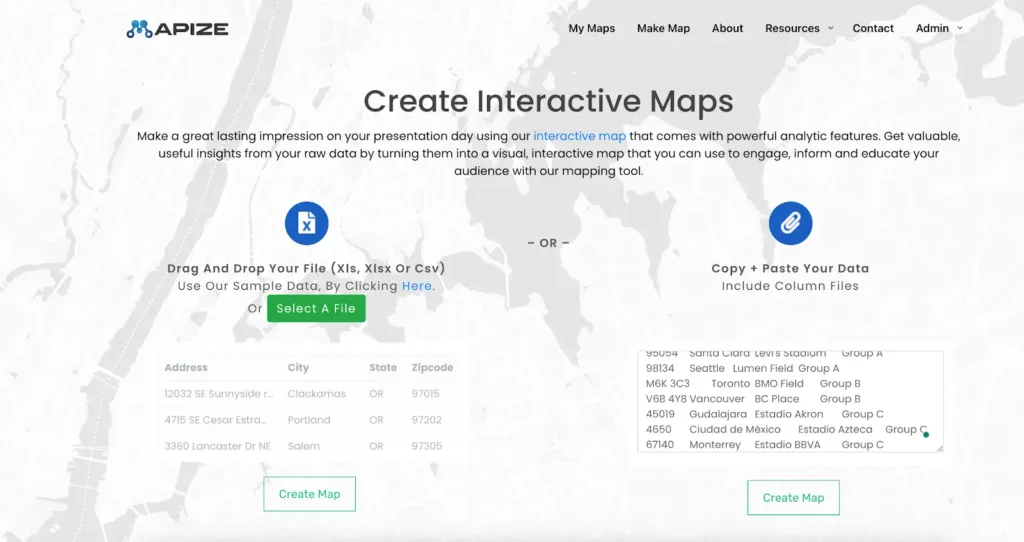
- Opt for the “Import data” feature, uploading the file that houses your data. The platform offers drag-and-drop for file importation.
- Mapize recognizes zip codes and additional data columns within your file. This stage allows for the refinement of column names and types, preparing you for the next step with a click on “Next.”
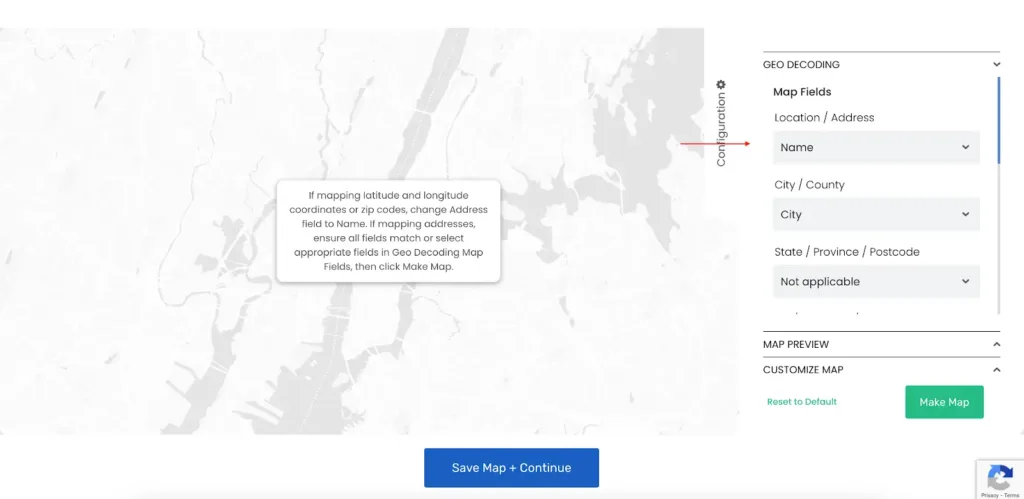
- The service then plots your provided data onto a map based on the zip codes, offering interactive capabilities like zooming, panning, and rotation for an immersive data visualization experience.
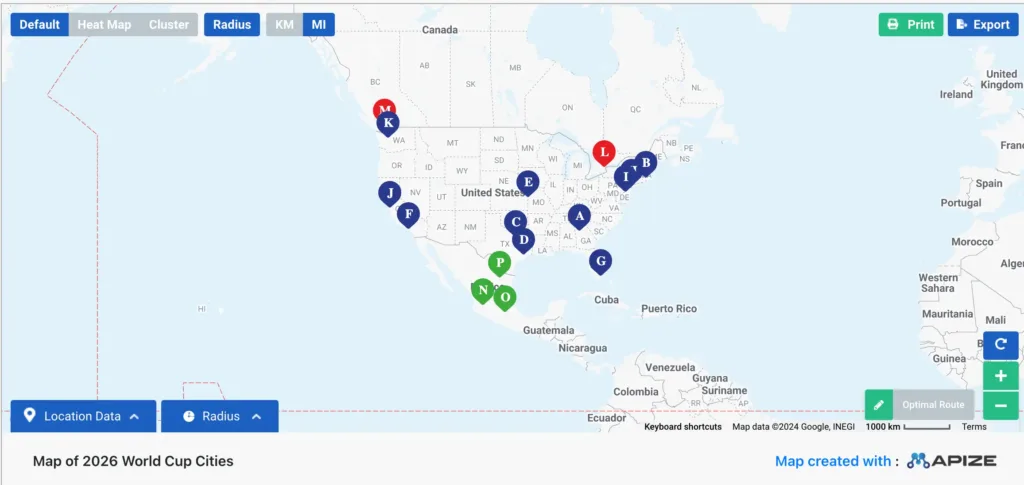
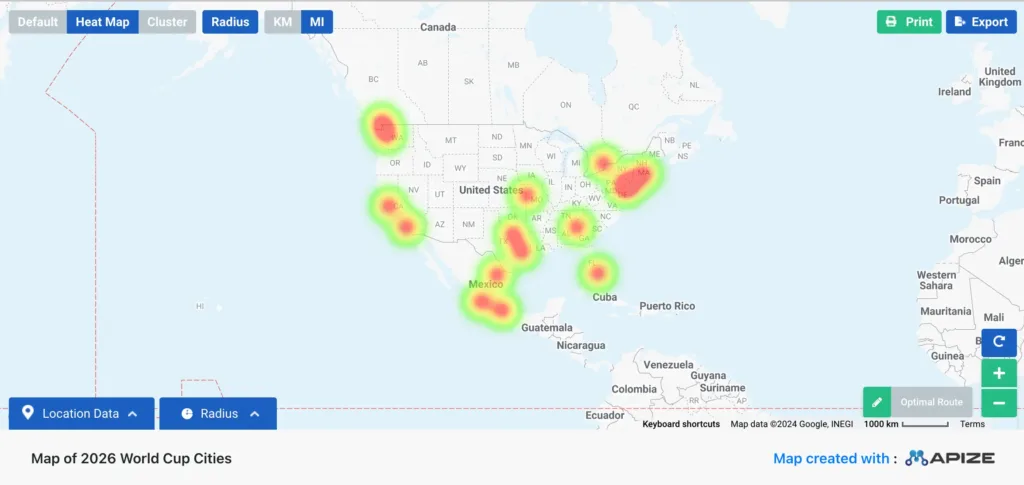
- Switch to the “Style” tab to customize your map’s look and features. Change map types, themes, and styles. Adjust colors, labels, symbols, and filters for data points. Add extra layers like heat maps, territory boundaries, or markers to enhance your map.
The “Share” tab lets you finalize, share, or export your map. Get a link to share, embed the map on websites, or download it in various formats.
With these steps completed, your zip code map is ready with Mapize and will be a valuable tool for data exploration, analysis, and communication.
To make any modifications or updates to your map, simply revisit the dashboard and select the map.
Advanced features for ZIP code maps
Once you’ve created a basic ZIP code map, many tools allow you to add advanced layers to extract more insights from your data.
Proximity radius circles
Proximity radius circles highlight areas around a central point. They help you calculate distances between ZIP codes and a reference location or identify which ZIP codes fall within a specific radius.
For example, you can:
- identify all ZIP codes within 10 miles of a retail store
- evaluate how close competitors are to your locations
- estimate service coverage for delivery or field operations.
To add a proximity radius circle:
- Prepare your reference data: Make sure your dataset includes accurate ZIP codes and coordinates.
- Set the center location: Choose the ZIP code or address that will serve as the reference point.
- Define the radius distance: Select a distance such as 5, 10, or 50 miles, depending on your use case.
- Generate the circle layer: Tools like Mapline or Mapize can automatically generate circles and highlight all ZIP codes within that distance.
Radius layers are commonly used for site selection, logistics planning, and competitor analysis.
Data overlays
Another powerful feature is the ability to overlay external datasets on your ZIP code map.
Common overlays include population density, sales or revenue by ZIP code, customer distribution, delivery volumes, or service requests.
Overlaying additional data helps transform a simple ZIP code map into a decision-making tool. For example, Brizo’s retail team spot-checks its customers’ presence in each city using real population data.
Exporting your map
Most online map makers support exporting in diverse formats like PNG, JPEG, PDF, or KML. Some platforms also allow for sharing via links or embed codes, which is helpful for websites or blogs.
Foursquare Studio, for example, offers various exporting options to meet different needs and purposes.
Conclusion
Creating a ZIP code map is one of the simplest ways to turn location data into actionable insights. Whether you’re analyzing sales performance, defining delivery zones, or exploring new markets, visualizing data by ZIP code helps reveal geographic patterns that are difficult to identify in spreadsheets alone.
In this guide, we covered how ZIP code maps work, different tools you can use to build one, a step-by-step example using Mapize, and advanced features like radius analysis and data overlays.
The key to building reliable maps is starting with accurate ZIP code reference data. Once your data is clean and structured, most mapping tools can quickly transform it into interactive visualizations.
With more than 15 years of experience, we offer the most accurate and up-to-date geocoded ZIP code data for the whole world. Browse GeoPostcodes datasets and download a free sample here.
FAQ
Can I make a map of ZIP codes?
Indeed, using only zip codes to craft a map visualization is achievable with various online resources and techniques.
One notable option is Mapize, a robust tool that enables you to create a zip code map by allowing users to upload their data, including zip codes, through a spreadsheet or Google Sheets, simplifying the mapping process.
How to create a map from a list of ZIP codes
Several strategies are available to create a map from zip codes.
One approach is to use Microsoft Excel to develop a map chart tailored to your zip code data.
Google Maps also allows you to plot multiple zip codes by inputting them into the search bar.
Tools specifically designed for creating zip code maps, such as BatchGeo, Mapize, or ShowMyMap, present another alternative.
These platforms enable users to input their data and zip codes, generating a map equipped with diverse functionalities.
How to map ZIP codes in Google Maps
Compile the zip codes in a spreadsheet, export them as a CSV file, and import them into Google My Maps.
Can Microsoft Excel generate a ZIP code map?
Microsoft Excel is equipped to create a ZIP code map.
By leveraging the Geography Data Type, ZIP codes can be transformed into geographical entities on your map.
Subsequently, utilizing the Filled Map Chart feature allows for the visualization of those locations through a map derived directly from your data.
How can I create a ZIP code map using address, city, state, and ZIP codes?
To create a zip code map using an address, city, state, and zipcode, you can use online mapping tools or GIS software.
These tools allow you to input detailed location data, such as the address, city, state, and zipcode, to visually represent the zip code areas.
Are ZIP Code Tabulation Areas (ZCTAs) by the U.S. Census Bureau the same as ZIP codes?
The U.S. Census Bureau offers geospatial data, including Zip Code Tabulation Areas (ZCTAs).
ZCTAs are generalized versions of USPS zip codes made for census data.
They’re accurate for demographics and analysis but aren’t updated often.
So, they might not show recent changes in zip code boundaries due to urban development or other factors.
How do I plot ZIP codes on a map
To learn how to plot ZIP codes on a map, use zip code boundaries to create custom ZIP code maps.
Display only ZIP codes by adjusting the default map view.
Once customized, generate a unique map link to share or embed your map easily.
Why use ZIP codes instead of coordinates or addresses?
ZIP codes provide a convenient way to group many individual addresses into a single geographic area.
Instead of mapping thousands of individual points, analysts can aggregate data by ZIP code to reveal regional patterns more easily.
Using ZIP codes is especially useful for:
- sales and marketing analysis
- delivery zone planning
- demographic analysis
- market coverage mapping
Coordinates provide more precise locations, but they can produce dense maps that are harder to interpret at scale.
ZIP codes simplify the data by grouping addresses into manageable geographic units, making trends easier to visualize.
In practice, many organizations combine both approaches: coordinates for precise locations and ZIP codes for aggregated geographic analysis.