
Key Takeaways
- Zip code polygons enable georeferencing for BI, sales, and spatial analysis
- Build polygons using postal data or create from geocoded points
- Align boundaries with administrative divisions for better accuracy
- Handle multi-zip municipalities by subdividing with Voronoi methods
Introduction
Because zip codes are generally the most granular geographic unit that is easily obtainable, organizations often use them as data points for location-specific decisions, such as whether to open a new warehouse or close a store.
Zip codes can be spatially represented through a pair of coordinates (latitude and longitude) to approximate their center. However, as the areas they cover vary in shape and size, such representations fall short of exhibiting their actual extents and relationships—such as information on neighboring zip codes or links with other geospatial data.
For some applications, visually defining the boundaries of a zip code using a polygon database is critical. It offers a geographical representation of a territory that lets you georeference a dataset much more accurately. Zip code polygon databases are especially useful for BI maps, territory mapping, spatial analysis, and reverse geocoding.
💡 Use accurate international zip code data to build a zip code polygon database. Our location data is updated weekly, relying on more than 1,500 sources. Browse GeoPostcodes datasets and download a free sample here.
This article shows you how to build a postal polygon database. You will learn how to translate point data into polygons using Voronoi polygons and increase accuracy by using the finest administrative divisions.
What Is a Zip Code Polygon Database and When to Use It
A polygon is a two-dimensional geographical representation that defines the exterior boundary or area of something using a sequence of points and lines. They are often used to show the boundaries of cities or buildings on maps.
A zip code polygon database is a database of such geographical representations based on zip code data. They show the geographical limits of the zip codes within a territory.
In addition to helping users find zip codes within a certain area or showing the boundaries of zip codes, a zip code polygon database is useful for:
- BI reporting: For instance, you can build a map that highlights your performance per zip code to inform marketing or optimize your store locations.
- Managing sales or delivery territories: You can easily visualize the areas covered by each zip code, link them to the volume of service, and create relevant area groupings to optimize the capacity of your units, whether they are trucks, cargo bikes, or salespeople.
- Spatial analysis: It lets you relate zip codes to other spatial features such as factories, shops, parks, water bodies, and so forth. For instance, it can help assess insurance risk in relation to the distance to the sea or some other feature.
- Reverse geocoding: Refers to inferring zip codes from coordinates or GPS data. It lets you cross-reference other data sources at the postal level, and it can be used, for example, to trigger an automatic message when a customer signs up in a certain zip code area. Learn how to build a zip code to coordinates converter here.
How to Build a Zip Code Polygon Database
This article covers two ways to construct a zip code polygons database: when a good source for zip code polygon data is readily available, as well as when you only have access to underlying data in the form of points—typically, addresses or postcode centroids.
Prerequisites
To follow along with this article, you need:
- GIS software to visualize geographical data. This article uses the free, open-source system QGIS.
- SQL knowledge. This article uses SQL to process the data and some PostgreSQL extensions: PostGIS for geographic functions and PL/pgSQL as a procedural programming language.
Since you will be working with maps, some geographical knowledge is a plus.
Method 1: Using Postal Code Polygons from a Source
In some cases, you might be able to obtain polygons with the postal information you need from reliable sources.
The most common sources are open data initiatives of certain countries’ geographic institutes or postal systems. For example, the Geoportal of Belgian’s federal government has a free database of postal polygons from the national postal service in Shapefile format. Many collaborative initiatives, like OpenStreetMap, also publish postal polygons in some areas.

Where postal polygons are readily available, the steps are straightforward: you only need to find the source, make sure you respect its license terms and integrate it into your data.
However, these sources may not be perfect or up-to-date. Even if you can access readily available postal boundary data, you’ll therefore need to consider its quality and whether you can risk sacrificing accuracy and completeness for convenience. For instance, the Belgian postal boundaries omit some postal enclaves. Using high-quality geocoded points, as you’ll learn how to do in the next section, can help refine the boundaries.
💡 Discover postal and administrative boundaries for 247 countries. Our location data is updated weekly, relying on more than 1,500 sources. Browse our database for free here.
Method 2: Building Polygons using Point Data
If you do not have a direct source of postal polygons or if it’s not accurate or complete enough, you can build your own polygons from other data.
Sourcing Zip Code Points
The first thing you need to find is a high-quality source of geocoded points that contain information on postal codes.
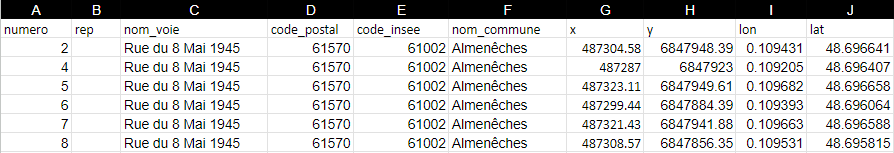
This article uses the National Address Base of France with good-quality, open data. This database offers useful information, like street names, house numbers, postal codes, municipality names, and coordinates.
To generate the postal code polygon for this tutorial, you’ll use the coordinates (longitude and latitude) and postal codes from this database.
Start by downloading the data from the National Address Base of France. Select the adresses-france.csv.gz file, found roughly in the middle of the list of files, to get data for the whole country.
Next, upload the CSV to a PostgreSQL database in a table called zips.source_points. Most SQL clients, such as PgAdmin and DBeavers, offer functionalities to upload a CSV directly from the graphical interface.
To process geospatial data, we will leverage the PostGIS extension of PostgreSQL. You can simply activate it by executing CREATE EXTENSION postgis; in a psql prompt.
Now, you can convert the coordinates in zips.source_points to geometry objects with the following queries:
ALTER TABLE zips.source_points ADD COLUMN geom geometry(Point,3857);

UPDATE zips.source_points SET geom = ST_Transform(ST_SetSRID(ST_MakePoint(long, lat), 4326),3857);
Estimating Zip Code Boundaries with Voronoi Polygons
Next, you’ll use the geocoded addresses you obtained in the previous step to build Voronoi polygons representing postal boundaries.
First, what is a Voronoi tessellation? It’s a partition of a space into multiple polygons based on point distribution. Points are considered seeds, and the linear delimitations of the Voronoi diagram are points that are equidistant to the two nearest seeds. A Voronoi cell consists of all points of the space that are closer to that seed than any other.
The image below illustrates the equidistance of a Voronoi diagram with seeds in blue and tessellations in red.
](https://i.imgur.com/ItGlm0V.png)
Voronoi polygons are a powerful tool for understanding and analyzing spatial data. They provide a way to divide a plane into regions based on the distances to a set of points, allowing for a polygonal representation of the underlying punctual data. Since the database you’re using has multiple addresses for the same postal code, you’ll obtain numerous Voronoi cells for each postal code. To build the postal polygons, you’ll merge the Voronoi polygons corresponding to the same postal code.
To generate Voronoi polygons in PostGIS—the geographical data processing extension of PostgreSQL—you’ll use the ST_VoronoiPolygons function. Three parameters are needed: the geometry of the source of points; the tolerance (ie, the distance within which vertices will be considered equivalent); and the geographical extent (ie, territory) you want to cover. The signature of the function is:
ST_VoronoiPolygons( g1 geometry , tolerance float8 , extend_to geometry );
You are going to call that function from a PL/pgSQL script handling all the other steps. PL/pgSQL lets you write functions and procedures that are stored and executed within the database, making it easier to write complex and efficient queries. It combines SQL’s simplicity and ease of use with the power and flexibility of more traditional programming languages.
Consider this example PL/pgSQL function, zips.voronoi_geom():
CREATE OR REPLACE FUNCTION zips.voronoi_geom(p_geom geometry)
RETURNS void
LANGUAGE plpgsql
AS $function$
DECLARE


begin


   --
   -- SETUP
   --


   DROP TABLE IF EXISTS zips.voronoi;
   CREATE TABLE IF NOT EXISTS zips.voronoi(
       gid serial4 NOT NULL,
       zip varchar(20) NULL,
       geom public.geometry(multipolygon, 3857) NULL
   );
   CREATE INDEX IF NOT EXISTS zips_voronoi_sidx ON zips.voronoi USING gist (geom);

   CREATE TABLE IF NOT EXISTS zips.voronoi_pts (
       zip varchar(20) NULL,
       geom public.geometry(point, 3857) NULL
   );
   CREATE INDEX IF NOT EXISTS zips_voronoi_pts_sidx ON zips.voronoi_pts USING gist (geom);


   -- SELECT VORONOI POINTS (seeds) from the target geometry p_geom

   TRUNCATE TABLE zips.voronoi_pts;


   INSERT INTO zips.voronoi_pts(zip, geom)
     SELECT pt.code_postal, pt.geom
     FROM zips.source_points pt
     WHERE ST_Contains(p_geom, pt.geom);


   -- CREATE VORONOI polygons


   TRUNCATE TABLE zips.voronoi;


   INSERT INTO zips.voronoi(geom)
     SELECT ST_Multi(ST_Intersection((ST_Dump(geom)).geom, p_geom)) FROM (
       SELECT ST_CollectionExtract(ST_VoronoiPolygons(geom, 0.0, p_geom), 3) as geom
       FROM (SELECT ST_Collect(geom) AS geom FROM zips.voronoi_pts) p
     ) polys;


    -- label Voronoi polygons with corresponding zips from the points data
    UPDATE zips.voronoi a set zip = p.zip
    FROM zips.voronoi_pts p
    WHERE ST_Contains(a.geom, p.geom);


END;
$function$
;
It first creates the tables that will be used in the rest of the function. It sets up ‘zips.voronoi’ to store the geometry polygon results and ‘zips.voronoi_pts’ to store a subset of the geocoded postal codes. In this example, this is the geocoded addresses in France from zips.source_points. You could also adapt this code to whatever area you’re interested in, which can be smaller than an entire country.
It also creates indexes for these tables on the geometry using GiST to speed up your processes.
The body of the function is responsible for filling the `zips.voronoi_pts’ table with the geocoded postal codes belonging to the relevant area, generating the corresponding Voronoi polygons, and, finally, labeling those polygons with their corresponding postal code.
You can call the function by passing your area of interest (e.g., one region of France) as a parameter called p_geom in the function.
All the results are pushed into the table ‘zips.voronoi’.
So now we have one polygon per geocoded address in the source. But postal codes are usually shared by multiple addresses. To get the complete boundaries for every postal code, you need to make the union between all the polygons with the same postal information. This can be done with the following PostgreSQL/PostGIS query: SELECT zip, ST_union(geom) FROM zips.voronoi GROUP BY zip
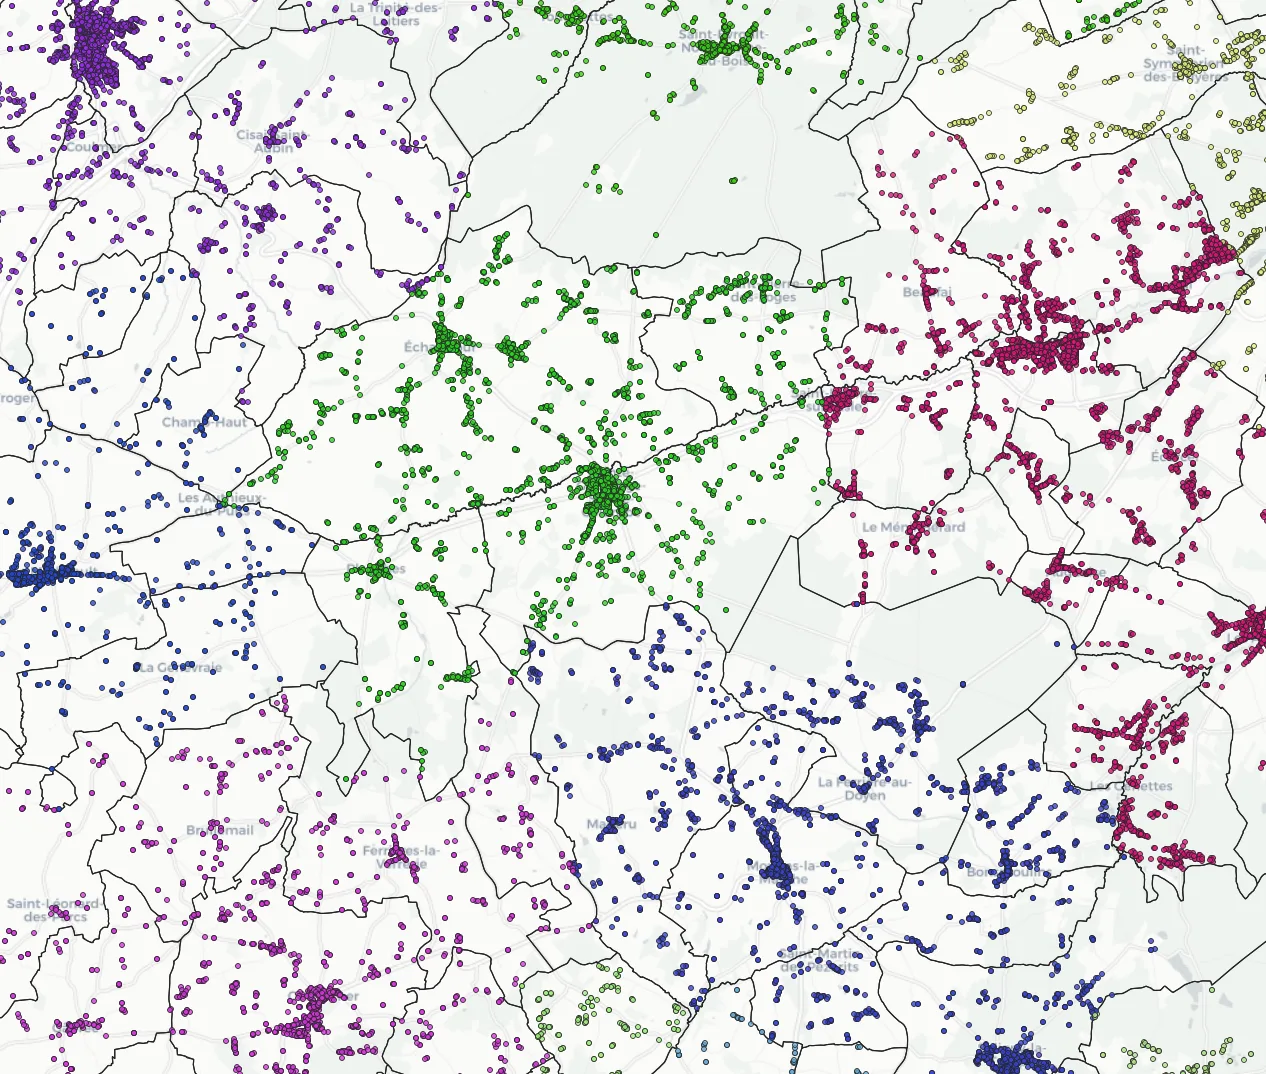
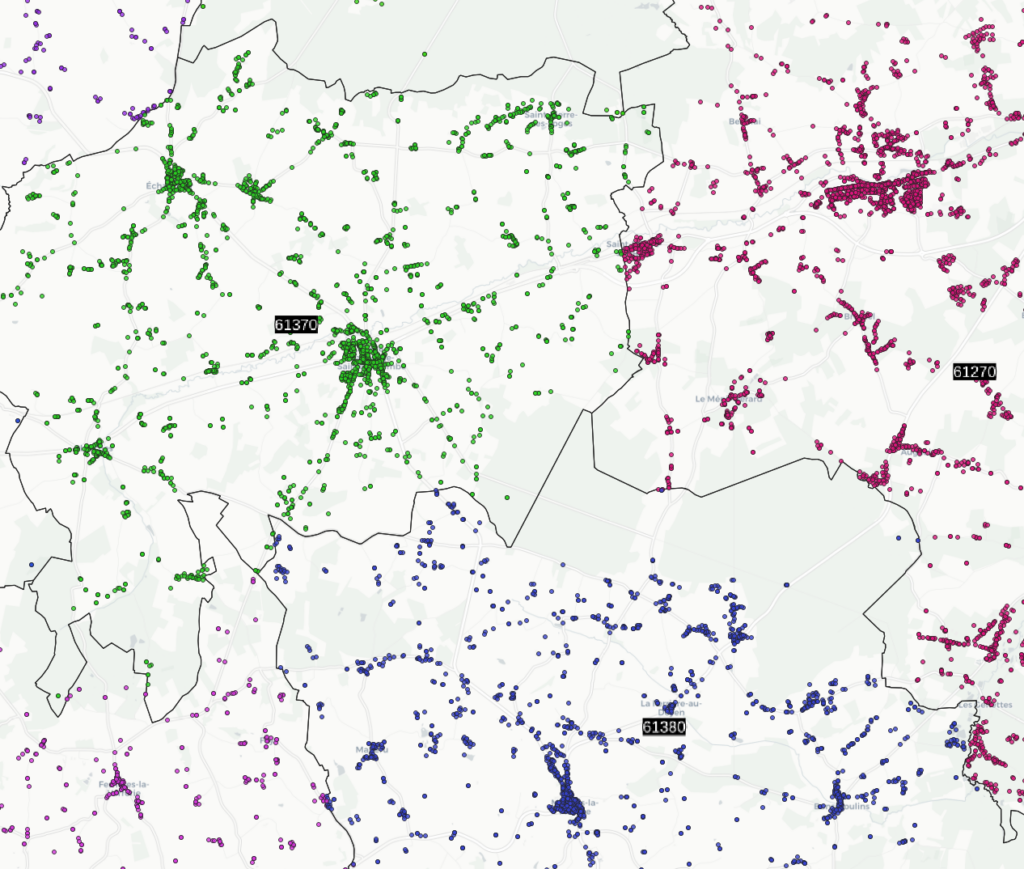
The images below show the result of the Voronoi tessellation of the postal codes for a part of France.
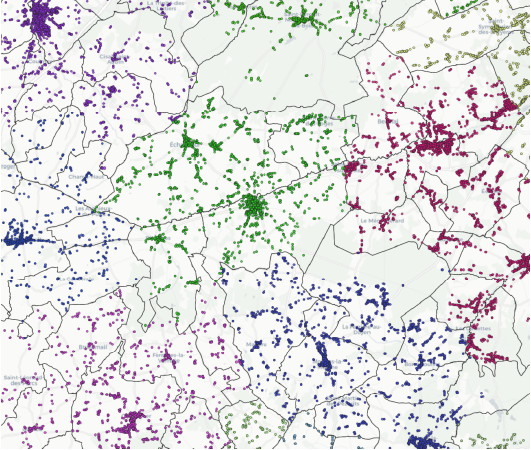
Points show the seeds colored by postal code, and lines show the resulting postal polygons after Voronoi generation and grouping by postal code.
Refining Zip Code Boundaries Using Administrative Divisions
The method above makes the most of the available data points, but you can improve the accuracy of your database if you know something about the postal system.
Zip codes are most commonly based on administrative divisions. For instance, in France, zip codes usually cover one or more entire municipalities, locally known as communes. This knowledge can help you refine your postal boundaries by aligning them with municipalities.
In theory, if your geocoded source is perfect—in other words, it contains an exhaustive list of addresses with correct zip codes and coordinates—you don’t really need this extra step. But in practice, data sources are rarely perfect. Even if they were, this extra step means that if addresses are added in the future, you likely won’t have to recompute the boundaries. Your postal boundaries will stay valid.
So, how do you leverage administrative division data?
French zip codes are based on municipalities, so you can construct French postal boundaries by aggregating municipalities. And, yes, you’re right to think you could have skipped the Voronoi step altogether. But hang on. You’ll see later that there are a few exceptions to the rule that one postal code covers one or more entire municipalities. This justifies using geocoded points in combination with the boundaries of municipalities.
For this step, you’ll use the latest version of the French communes, or municipalities, extracted from OpenStreetMap. It’s approved by the French Geographic Institute and mainly issued from the national cadastral division.
Start by downloading the municipalities.
Next, load the administrative boundaries table in QGIS by dragging the unzipped .shp file into a QGIS window. You will see a map of the French communes, and clicking on one commune will show you its properties, for instance, its name (“nom” in French), as shown below.


Next, unzip the file adresses-france.csv.gz (for example, with 7zip on Windows or the gzip utility in Unix systems) Then, upload the CSV with the geocoded addresses in QGIS so that you can look at both datasets simultaneously. In QGIS, you can import a CSV by clicking Layer, Add layer, and then Add delimited text layer. Select your address file and, if necessary, specify the latitude and longitude columns.
It is helpful to color the address points by postal code. To do so, right-click on “address-france” in the layers panel (by default on the left side in QGIS), then choose Properties, Symbology, on the top, Select Categorized instead of Single Symbol, then Select code_postal as Value, hit Classify at the bottom left and OK when it’s done.
You should obtain a map similar to the screenshot below, where the geocoded addresses are colored by postal code, and the black lines show the boundaries of the municipalities:
This overlay clearly shows the pattern of municipalities covered by one postal code. Since you sometimes have to work with badly encoded data—in other words, addresses with wrong coordinates or zip codes—it’s best to assign the most frequently occurring postal code from the geocoded addresses to a municipality.
This is an example of leveraging your knowledge (each municipality has only one postal code) to remove some outliers in the data.
Dealing with Exceptions
Of course, you always have to keep exceptions in mind.
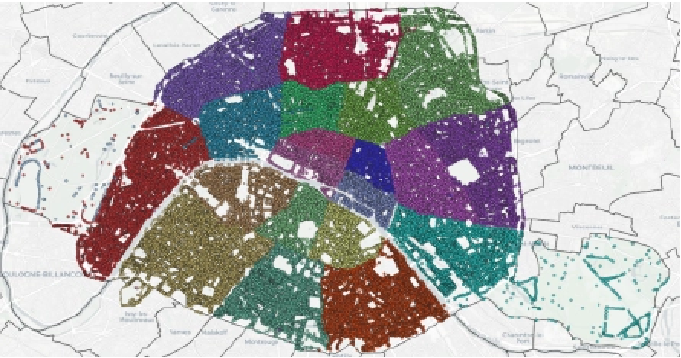
In this example, one municipality isn’t always covered by a single postal code. Big municipalities like Paris, Lyon, or Marseille use several zip codes based on further administrative divisions, such as arrondissements in Paris. The map below shows geocoded addresses for Paris colored by postal code:
It’s also the case for a few smaller municipalities.
To account for these exceptions, you need to allow some municipalities to be subdivided into several postal zones. For example, by applying the Voronoi algorithm to Paris’s data, you can obtain the postal boundaries below.

You can see that the result is much better than using only one postal code for the entire municipality of Paris. It is still not completely clean due to some badly encoded addresses in the initial dataset. You can refine these boundaries even more by finding polygons for the arrondissements of Paris.
How to Code the Generation of Zip Code Polygons
Let’s examine how all of this comes together with some code.
In this example, you’ll loop over all municipalities and look at the distribution of geocoded addresses they contain. You can set a percentage threshold as a parameter to see if one postal code is dominant. In that case, you will assign that postal code to the whole municipality and discard outliers. If not, you will subdivide the municipality into several postal zones corresponding to the different zip codes it contains.
PL/pgSQL lets you declare variables and records. It’s best to define your parameters once as variables. Records variables are similar to row-type variables, but they have no predefined structure. They take on the actual row structure of the row they are assigned during a FOR command, looping over the rows returned by a SELECT.
Here is the code for all these steps:
DO LANGUAGE plpgsql $$
DECLARE


   rec_reg record;
   rec_pol record;


   v_zip           varchar;
   v_pc_points     numeric;
   v_pc_zip_threshold numeric  := 90;


BEGIN


   ---------
   --SETUP--
   ---------


   DROP TABLE IF EXISTS zips.zips_results;
   CREATE TABLE zips.zips_results (
       zip varchar,
       geom geometry
   );
   CREATE INDEX zips_results_sidx ON zips.zips_results USING gist (geom);
   CREATE INDEX zips_results_zip ON zips.zips_results(zip);
   ALTER TABLE zips.zips_results ADD CONSTRAINT zip_unique UNIQUE (zip);


   -- create table regrouped_voronoi
   IF NOT EXISTS(SELECT * FROM information_schema.tables WHERE table_name='regrouped_voronoi' AND table_schema='zips')
   THEN
       CREATE TABLE zips.regrouped_voronoi (
       zip varchar (10),
       geom geometry
       );
       CREATE INDEX regrouped_voronoi_zip_idx ON zips.regrouped_voronoi(ZIP);
       CREATE INDEX regrouped_voronoi_sidx ON zips.regrouped_voronoi USING gist(geom);
   END IF;


-- LOOP OVER MUNICIPALITIES
       FOR rec_reg IN
           SELECT g.*
           FROM zips.geom_source g


       LOOP
               -- split region geom into constitutive individual polygons
               FOR rec_pol IN
                   SELECT rec_reg.id,
                   generate_series(1, ST_NumGeometries(rec_reg.geom)) num_polygon,
                   ST_GeometryN(rec_reg.geom, generate_series(1, ST_NumGeometries(rec_reg.geom))) geom
               LOOP

                       -- reset variables
                       v_zip := NULL;
                       v_pc_points := 0;


                       -------------------
                       -- Assign top zip class from points table if % points > threshold
                       WITH max_count AS (
                           SELECT count(*) c
                           FROM zips.source_points p
                           WHER ST_Contains(rec_pol.geom, p.geom)
                       )
                       SELECT p.zip, 100 * count(*)/ m.c INTO v_zip, v_pc_points
                       FROM zips.source_points p , max_count m
                       WHERE ST_Contains(rec_pol.geom, p.geom)
                       GROUP BY p.zip, m.c
                       ORDER BY 2 DESC
                       LIMIT 1;

                       IF (v_zip IS NOT NULL AND v_pc_points > v_pc_zip_threshold) THEN

                           -- upsert into zips table: append geom or create new zip row
                           INSERT INTO zips.zips_results AS z (zip, geom)
                           VALUES (v_zip,  ST_Multi(rec_pol.geom))
                           ON CONFLICT ON CONSTRAINT zip_unique
                           DO UPDATE SET geom = ST_Makevalid(ST_Multi(ST_Union(rec_pol.geom, z.geom)))
                               WHERE z.zip = v_zip;

                       -- reset v_zip if threshold is not reached
                       ELSE
                           -- generate Voronoi polygons with function
                           PERFORM zips.voronoi_geom(rec_reg.geom, rec_reg.id);
                           -- regroup in the table if polygons of the same zip code in work table
                           TRUNCATE TABLE zips.regrouped_voronoi;

                           INSERT INTO zips.regrouped_voronoi
                           SELECT z.zip, ST_Union(z.geom) geom
                           FROM zips.voronoi z
                           WHERE z.zip = zip
                           GROUP BY z.zip;

                           -- upsert destination table
                           INSERT INTO zips.zips_results AS z
                           SELECT t.zip, t.geom
                           FROM zips.regrouped_voronoi t
                           ON CONFLICT ON CONSTRAINT zip_unique
                           DO UPDATE SET geom = ST_Makevalid(ST_Multi(ST_Union(excluded.geom, z.geom)))
                               WHERE z.zip = excluded.zip;

                       END IF;
                   END LOOP;
       END LOOP;

END;
$$
The map below shows the results of the postal assignment before unifying the polygons corresponding to the same postal code:
Now let’s look at what it looks like after unifying them:
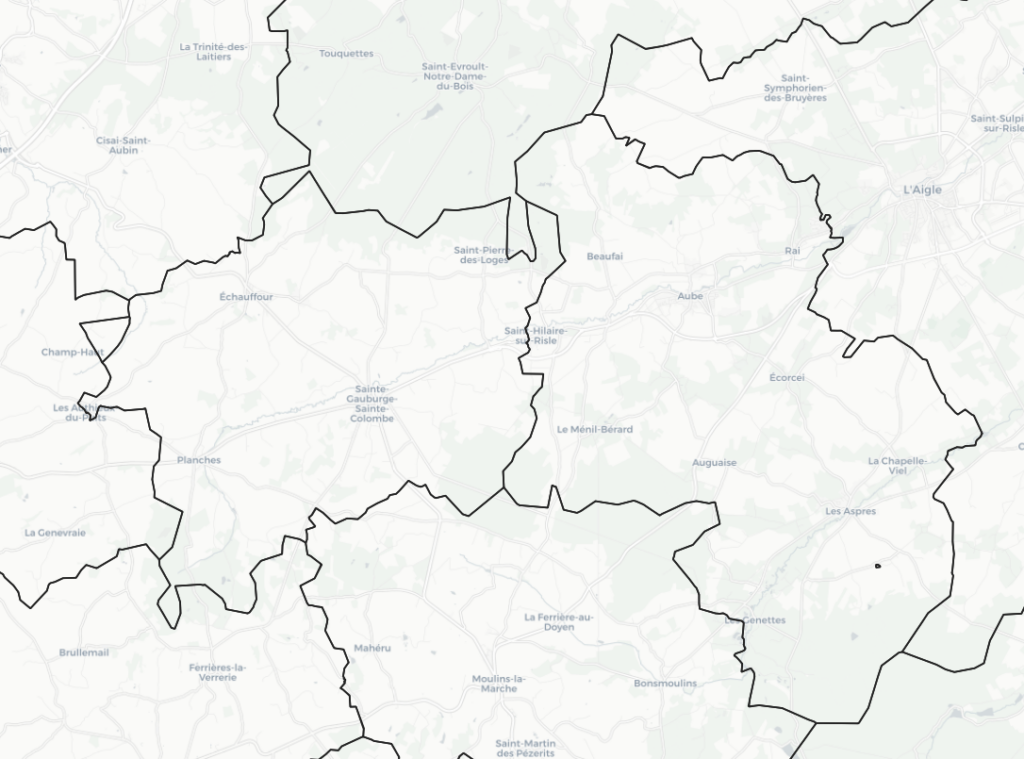
The following two maps display the results of the different ways to produce postal boundaries. The first shows the outcome you got earlier when you obtained postal boundaries by using only the address data to generate Voronoi polygons:
The second one shows the outcome of the complete algorithm that leverages administrative divisions to constrain the postal assignment and only runs Voronoi if there are several postal codes within the same municipality:
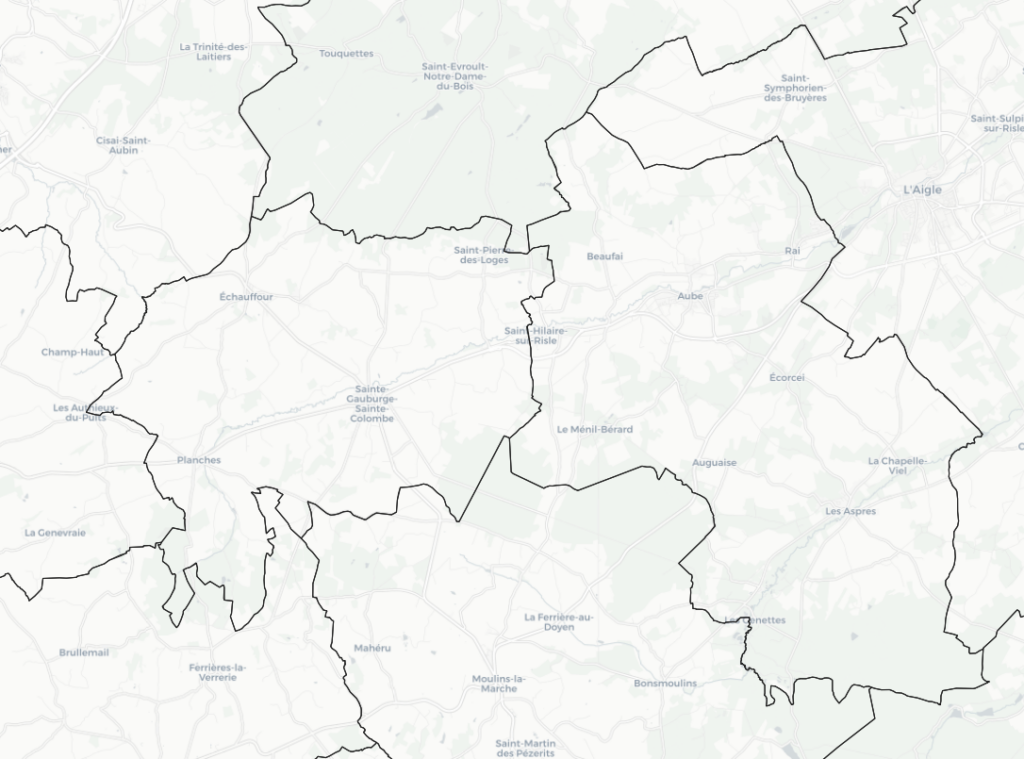
The results are pretty close. The high quality of the simple Voronoi tessellation in this example can be attributed to the good quality of the address source—many points are available and are properly geolocalized. The full algorithm filters out a few outliers, though. If the data from your address source were poorer, you can imagine that the improvement would have been even more pronounced.
Congratulations! You have now built zip code polygons for France using two methods.
You can apply these methods of creating a zip code database to other countries and with different administrative levels. This example is for a simple zip code system with high-quality data that’s available in open source.
Remember, though, that applying this method to several countries or aiming for high accuracy requires more work.
Also, keep in mind that advanced data processing techniques, such as clustering or combining multiple data sources, will give you even more accurate results. It applies more generally, as well as if you want to deal with all special cases at once without needing to find detailed data for each of them. Advanced data processing techniques can help you correct or remove outliers. However, such techniques are beyond the scope of this article.
Conclusion
This article showed you how to define boundaries with zip codes using the example of France.
As you can see, even with only one simple country, building zip code boundaries is not straightforward. You need a good source of geocoded data, gather information about the granularity of zip codes, find supporting administrative division boundaries, and deal with outliers and exceptions, including some this article didn’t cover, such as polygons without any geocoded point.
It’s even more challenging when you work on an international scale because each country’s zip code system and available data are different. Processing data from multiple sources or working across several countries means you have to deal with misaligned data. You’ll face overlaps or holes between neighboring polygons, especially at the borders of these sources.
So, if you need accurate and clean postal data at a large scale, you’ll benefit from acquiring it from a specialized team. At GeoPostcodes, we maintain a worldwide database of zip code polygons based on hundreds of sources to spare you the hassle.
We’ve designed algorithms to deal with special cases such as outliers, enclaves, and stacked points to ensure perfectly aligned borders globally. We also offer simplified boundaries that are optimal for web visualization. And be warned: although simplification looks straightforward at first, it requires advanced techniques to prevent small polygons from disappearing and preserve perfectly aligned boundaries after simplification.
You’re welcome to explore our data products and feel free to reach out to me if you want to discuss this topic further.
FAQ
How can I integrate Google Maps API with a postal code polygon database?
Integrating Google Maps API with a postal code polygon database allows for visualizing postal boundaries on a map.
You can use the API to plot polygon data, enabling detailed geographic analysis and enhancing location-based services.
Does the United States Postal Service provide postal code polygon data?
The United States Postal Service (USPS) does not directly provide postal code polygon data.
However, third-party providers aggregate this information from various sources.
How can I access postal code polygon data in SQL Server?
You can store and query postal code polygon data in SQL Server using spatial data types.
By importing polygon shapefiles into SQL Server, you can perform geographic queries and integrate this data with other business intelligence tools.
What is the Zone Improvement Plan (ZIP) in relation to postal code polygons?
The Zone Improvement Plan (ZIP) was introduced by USPS to improve mail delivery efficiency.
Postal code polygons represent the geographic areas served by each ZIP code, which helps in optimizing logistics and delivery routes.
Why do some ZIP code regions have strange assignments?
The United States Postal Service (USPS) creates ZIP code regions based on mail delivery routes, not geographic boundaries.
This can result in strange ZIP code assignments, especially in mid-sized urban areas or locations with a sparse network of addresses.