
Key takeaways
- Territory planning accuracy improves dramatically, with distance errors decreasing five-fold using rectified polygon datasets.
- Companies using boundary data report significant cost savings in logistics and marketing.
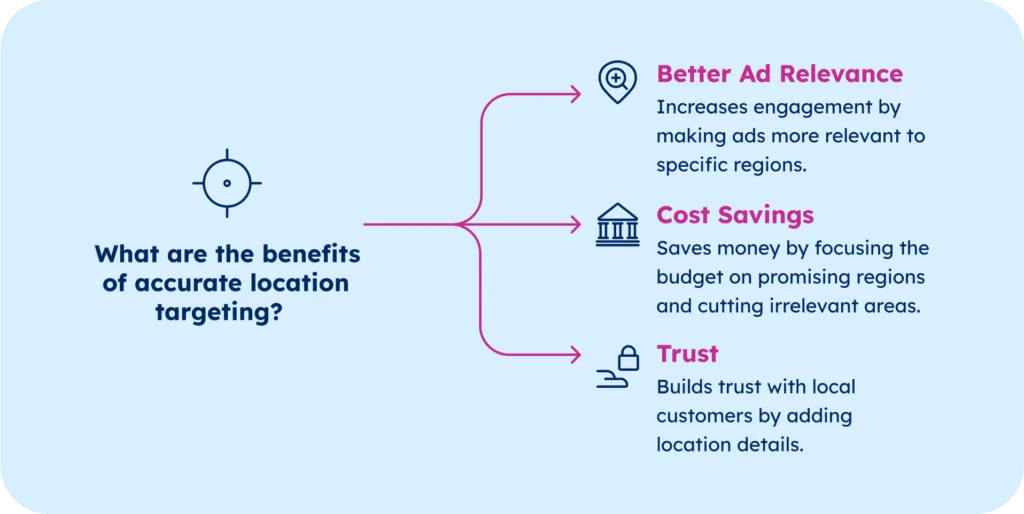
- Business benefits from accurate polygon data for:
- Risk aggregation from raster data (flood zones, wildfire probability maps) into administrative units
- Topologically accurate boundary alignment for supply chain disruption modeling
- Multi-level hierarchical territory optimization for field operations
- Geofencing accuracy for location-triggered marketing automation
Introduction
Your delivery cost calculations are off by 20%. Your geofencing campaigns trigger three blocks away from your actual store. Your sales territories overlap, creating duplicate coverage while leaving gaps in high-value markets. The culprit? Using point data when you need polygon precision.
The difference between using simple coordinates and precise polygon boundaries isn’t just technical, but financial. When making big calls about where to operate, expand, or deliver, the quality of your geographic data is the key for everything.
Point data is just a pin on the map. It tells you where, but not what. It’s a dot, not the whole picture. Polygon data draws a place’s actual shape and size, including delivery zones and sales territories. You see full boundaries, not just a center point.
Polygon datasets give businesses what point data can’t: context. And in location-driven decisions, context is gold. You can spot overlaps, gaps, proximity, and density—the spatial details that power logistics, market analysis, and planning.
In this article, we’re breaking down how polygon datasets fuel smarter decisions. We’ll show where they’re critical, why accuracy is non-negotiable, and how these boundaries unlock insights that plain coordinates never will.
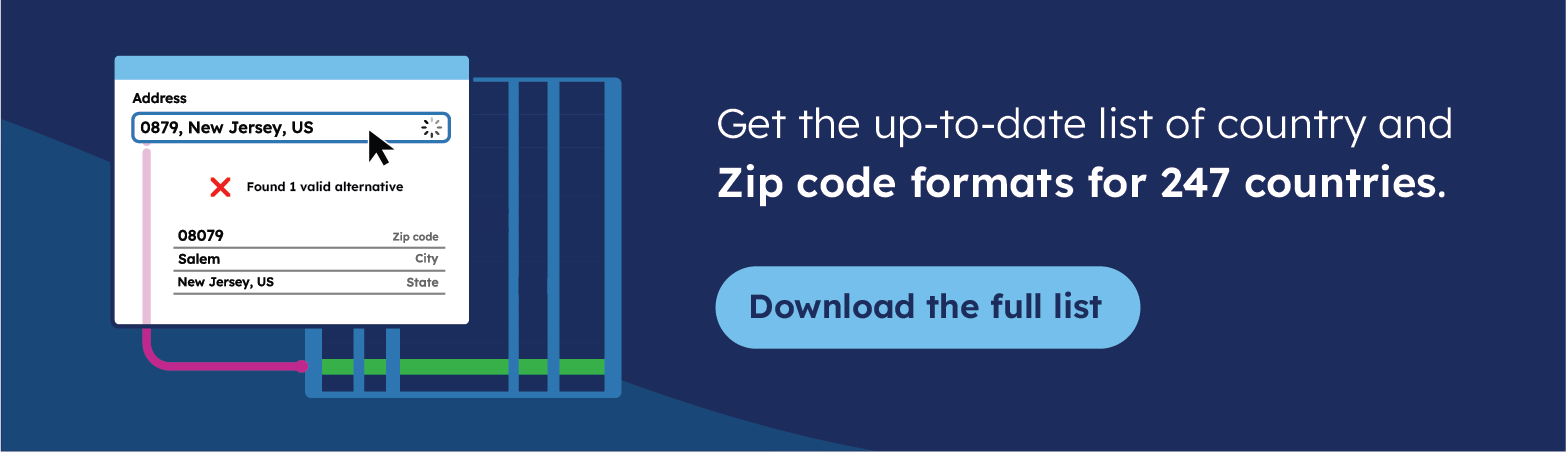
💡 Get postal and administrative boundaries for 247 countries, including difficult geographies such as China, the UK, Russia, or Brazil. Try our boundaries database for free.
Understanding Polygon Data
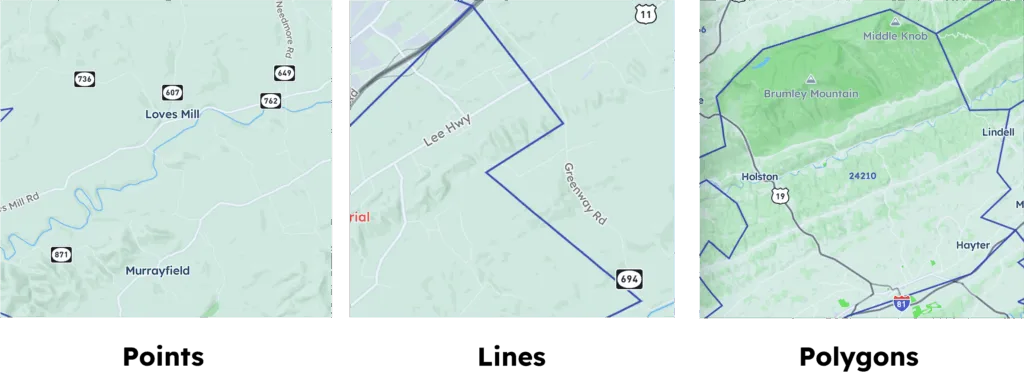
In the GIS (Geographic Information Systems) world, everything starts with three basic building blocks: points, lines, and polygons. They are like the grammar of geospatial data, and polygons are the whole sentences.
Points are your basic pins — a single coordinate marking one exact spot. Lines connect those points like roads, pipelines, or shipping routes. And polygons turn coordinates into shapes — actual areas with real-world boundaries. They show where something begins and ends.
In plain terms, a polygon is a set of x and y coordinates that outlines an area. But in business, it’s the difference between knowing a storm hit “Kansas” and being able to pinpoint which ZIP codes were affected, which addresses are at risk, and how exposure maps to insured areas.
We are talking from the specific postal code zone up through municipal, state, and federal administrative levels — that determine shipping costs, tax jurisdictions, and regulatory compliance across Brazil’s geography.
The Unique Value of Polygon Data
Many businesses around us utilize polygon data in their strategic approach, as they bring them so many special values that point data can’t deliver—like defining coverage areas, mapping risks to regions, aggregating data by boundaries, and aligning with tax or legal zones.
For example, Sephora’s Store Companion advertising campaign boosted Sephora’s loyalty program members by 25 million. This precision targeting relies on accurate polygon data defining store boundaries rather than simple point coordinates.
Despite its benefits, polygon data is only as valuable as it is accurate. For retailers, inaccurate boundaries mean missing customer engagement opportunities or triggering notifications when customers are nowhere near the actual store, undermining campaign effectiveness and wasting marketing spend. And this kind of error also costs real money in insurance or logistics.
What qualifies as “accurate” polygon data? Topological accuracy ensures that polygon boundaries have no gaps, overlaps, or misaligned edges—the spatial relationships that maintain data integrity. Without proper topology, even small gaps or overlapping areas (called “slivers”) between polygons lead to inaccurate spatial analysis results that businesses can’t rely on.
When polygon datasets are topologically correct, they form what geospatial professionals call a “seamless fabric”—boundaries that perfectly align without spatial errors that could compromise business decisions.
Next, we’ll explain how polygon datasets drive smarter decisions, from streamlining operations to improving customer experience and market strategy.
Insurance Risk Assessment
Polygon data earns its keep in insurance risk assessment. Accuracy makes or breaks a risk model — miss it, and you’re either overpaying in claims or losing customers to overpriced premiums. Polygons give insurers the precision to assess property risk and set smarter rates confidently.
Polygon data provides detailed information about areas, regions, and postal codes. A nail salon next to a fireworks store? Different risk than one in a grocery store. That’s why neighboring businesses and adjacency matter.
Boundary polygons also enable insurers to aggregate complex raster risk data, like natural hazard risk areas, including flood zones, wildfire probability maps, or seismic activity grids, into meaningful geographic units such as postcodes, neighborhoods, or administrative areas.
This turns raw pixel-based risk data into actionable insights that align with how businesses and customers actually think about location.
For global insurers, accurate polygon data improves pricing, reduces errors, and sharpens risk and marketing strategies.
💡 With comprehensive polygon datasets, Opterrix enhanced risk analysis and hazard monitoring. Insurers now get precise visualizations to reduce losses per zip code and administrative area.
Environmental Risk Assessment and Mitigation
Beyond insurance, polygon data is essential for managing environmental risks. Retailers use it to see how close their locations are to flood zones, wildfire areas, or crime hotspots—helping them protect assets, reduce risk, and stay operational.
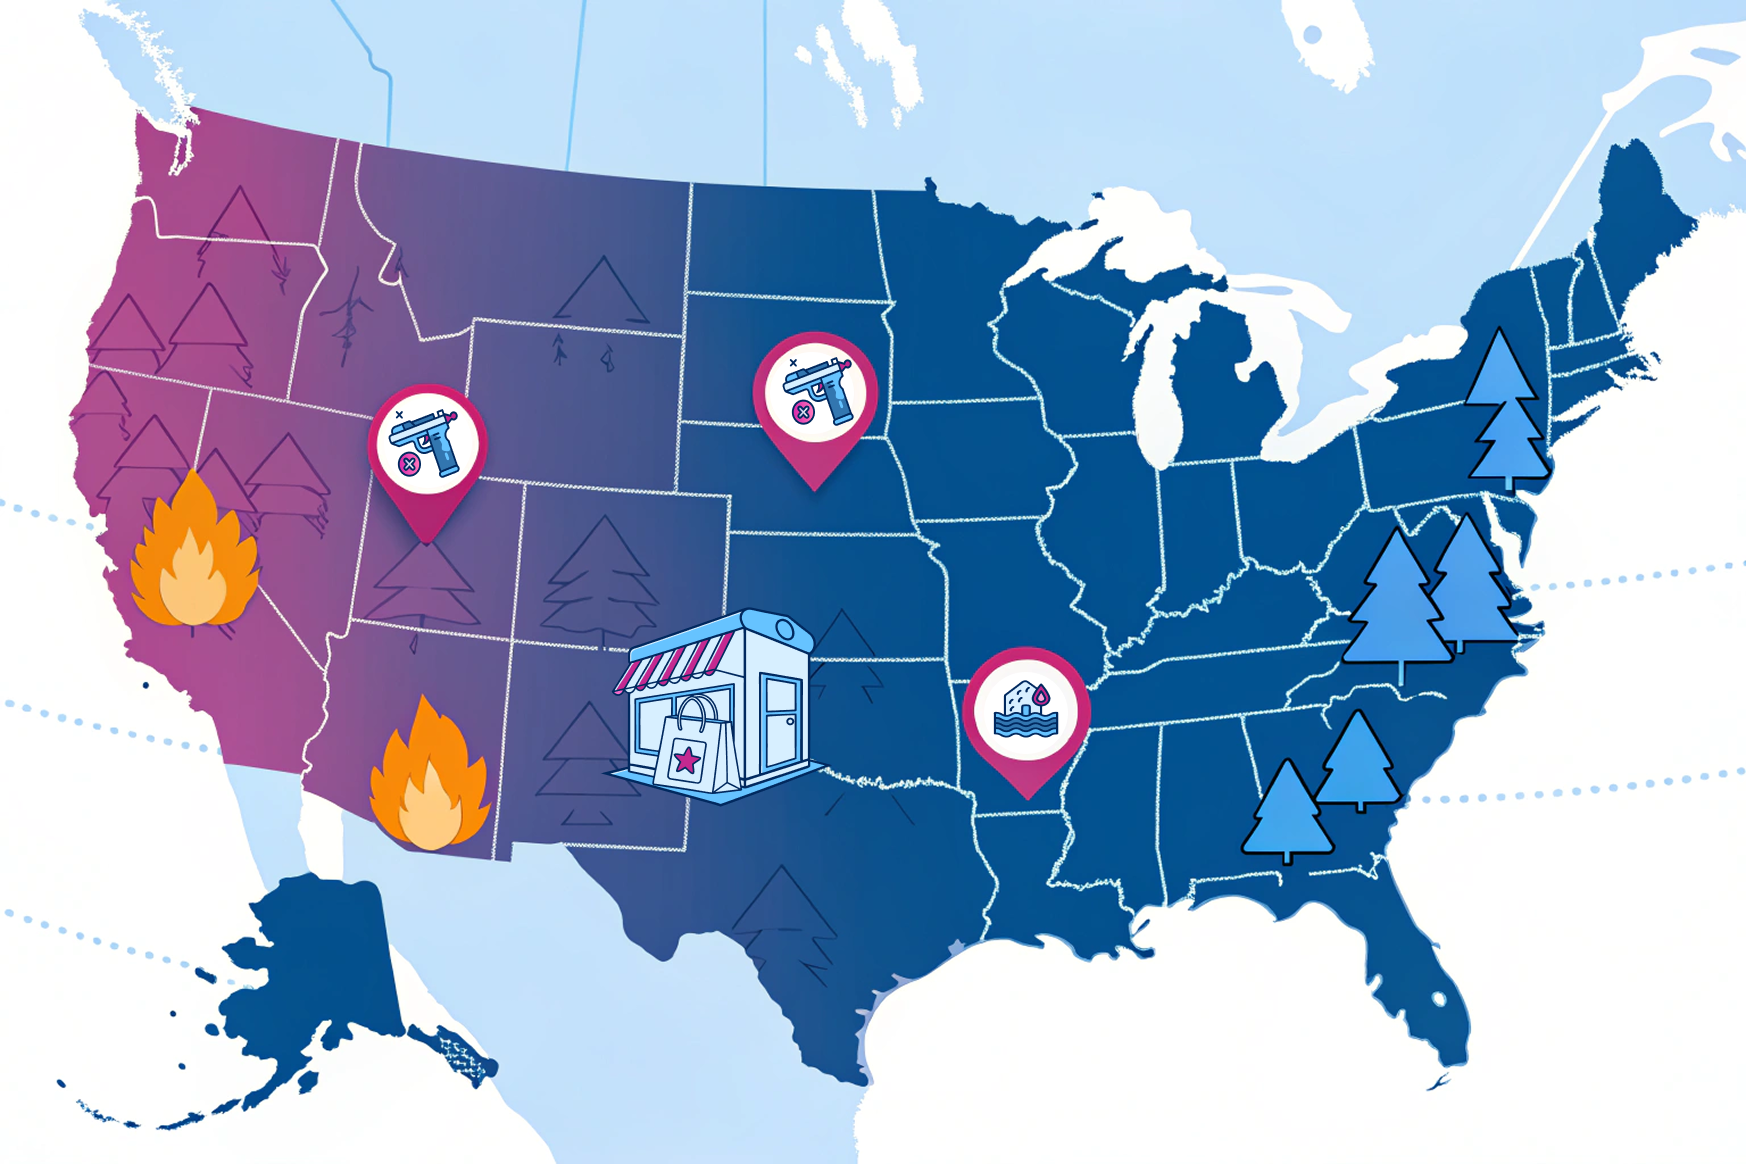
Supply chain teams map disruption zones and plan alternate routes. Developers assess environmental risks before building. Emergency response relies on clear boundaries to manage disasters effectively.
What makes it all work? Boundary accuracy. Polygons that align without gaps or overlaps give businesses a clear, reliable view of risk across every region they touch.
Geospatial Intelligence
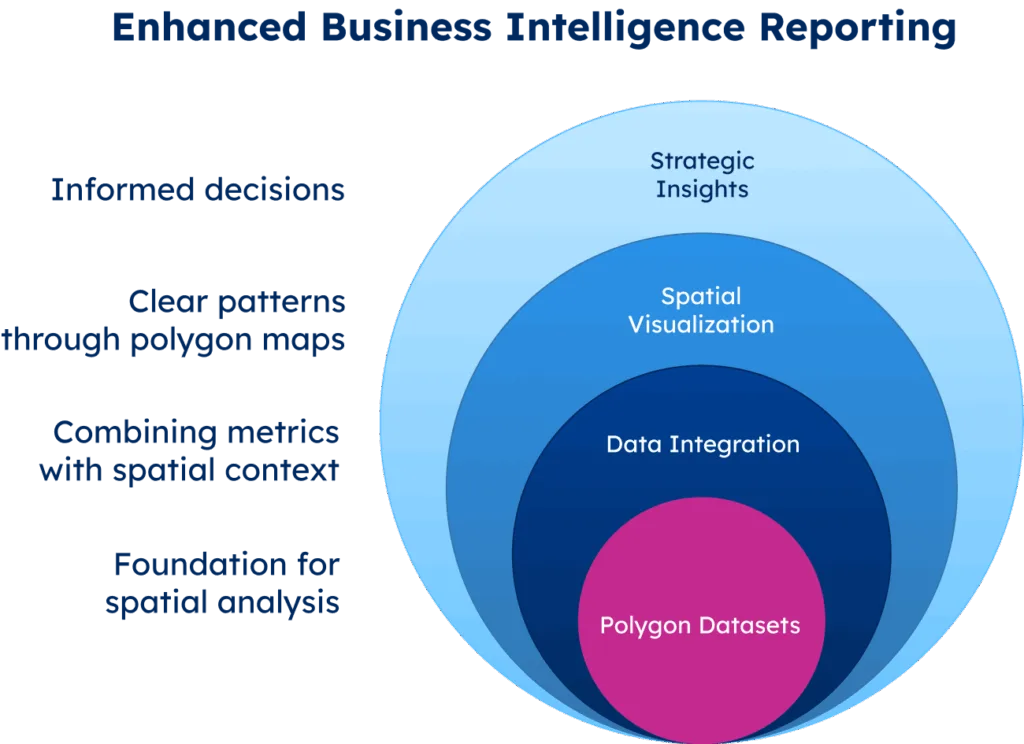
Modern business intelligence isn’t just about having data; it’s about knowing where it lives. That’s where polygon datasets come in. They add spatial context, turning static reports into dynamic maps that reveal what’s happening and where.
Overlay your KPIs for sales, traffic, and customer density on a polygon map; location-based trends and patterns jump out. In seconds, you analyze market trends, customer behavior, competitor activity, and more innovative opportunities for strategic location decisions.
For global businesses, it is critical. Map visualization brings consistency across markets, cutting through local quirks and mismatched boundaries. You’re not just analyzing numbers; you’re mapping strategy.
💡 Cisco relies on precise boundaries to determine optimal placement of infrastructure, data centers, and service coverage areas. They can access regulatory compliance across different jurisdictions, plan fiber optic routes around urban development, and optimize network performance by understanding the physical geography of their service territories worldwide.
Territory Management and Planning
Polygon datasets are the backbone of streamlined operations and smart territory management for businesses with field teams.
Mapping delivery or sales zones as polygons gives you clear visibility into coverage and makes planning routes and resources for logistics and supply chain far more efficient. You improve response times, reduce fuel consumption, and lower your carbon footprint easily.
The real advantage comes from organizing those areas around what drives performance, such as customer density, service load, or seasonal demand. They’re strategic assets. And for global operations, the same approach scales smoothly, turning complexity into clarity.
💡 Alignmix optimizes sales performance by integrating reliable polygon datasets within their Sales Territory Mapping software. Delivery zone boundaries improve routing calculations, assess warehouse capacity, and flag supply chain disruptions. Mapping supplier locations, distribution centers, and customer delivery areas as polygons lets them better predict transit times and save operational costs.
Location-Based Marketing
Polygon datasets give your marketing team precision. Instead of spraying ads across a wide area, you target exactly where your ideal customers are, based on real patterns, preferences, and behavior.
With polygon-based geomarketing, you’re carving out high-interest micro-markets. This approach helps you identify your campaigns’ most valuable geographic segments, ensuring your marketing budget focuses on areas with the highest potential return.
Geofencing takes this a step further by creating digital boundaries around these targeted areas. Think of it as a digital tripwire that triggers specific actions when customers enter or exit your defined zones. Your marketing campaigns deliver the right message at the right moment without wasting money.
The success of both strategies depends on boundary accuracy. Sloppy shapes mean missed chances or misplaced ads. With accurate polygon data, businesses can identify areas for improvement and implement location-based marketing strategies that enhance customer experiences and drive conversions.
💡 Eventim enriched their global internal data with accurate ZIP code coordinates. This helps them calculate distances between customers and event venues. Now they can deliver personalized recommendations and optimized marketing campaigns based on travel distance. The geographic insights help them understand fan distribution and traveling patterns, supporting strategic tour planning decisions across multiple countries.
Historical Data Analysis
When tracked over time, polygon data becomes a powerful historical analysis lens. It shows how neighborhoods evolve, customer behavior shifts, the economy develops, and market penetration grows or stalls.
This historical perspective is invaluable for long-term strategic planning. By understanding the trajectory of different territories or property types, companies can make more informed decisions about future investments, market exits, or expansion opportunities.
Population data adds another critical dimension to this analysis. When aggregated within polygon boundaries, demographic trends become visible across administrative areas, postal codes, and custom territories. You can track population growth, age distribution changes, income shifts, and migration patterns—all mapped to the exact boundaries that matter for your business decisions.
For global companies, historical polygon data smooths out regional quirks, making it easier to forecast trends and steer resources toward markets with real momentum. Combined with population insights, this creates a comprehensive view of market evolution that drives smarter expansion strategies.
Conclusion
In today’s data-driven world, polygon datasets are the backbone of smart location decisions. Their precision reshapes businesses’ understanding of geography, serving customers, and optimizing operations. Accurate polygon data will set leaders apart as location intelligence becomes more critical.
Investing in accurate polygons is essential for companies looking to unlock location data’s full value. That’s how raw data turns into real insight, ROI, and competitive edge.
We invite you to browse our data for free to explore how GeoPostcodes‘ comprehensive global polygon datasets can enhance your location intelligence capabilities. From over 1,500 sources and always up-to-date, our boundary data provides the accuracy and coverage you need to make confident spatial decisions.
FAQ
What is a polygon dataset?
A polygon dataset is a spatial file containing metadata and properties of geographic shapes, used by users across industries for risk assessment, historical data analysis, and operational efficiency.
What is the polygon data type?
The polygon data type defines geographic boundaries with metadata and properties, forming the basis for CSV exports, trust in spatial analysis, and asset classes evaluation.
What is the difference between a shapefile and a polygon?
A shapefile is a file format that stores geographic data, while a polygon is a specific geometric shape representing an area. A single shapefile can contain multiple polygons (like all US states), plus associated attribute data about each polygon feature.
How are polygon datasets used in location-based services?
Polygon datasets enable location-based services by defining precise geographic boundaries, improving accuracy in mapping, geofencing, and targeted service delivery across various industries.