
At its most basic definition, sales territory mapping is a technique for visualizing and analyzing how your customers and prospects are distributed across territories and how those territories are distributed across sales teams.
What is a Sales Mapping Software
Sales territory mapping software facilitates this visualization by integrating sales data with geolocation data. Sales managers and field reps can more effectively design territories according to customers and leads on a map, optimizing routes and increasing productivity in the field.
💡 For over 15 years, we have created the most comprehensive worldwide zip code database. Our location data is updated weekly, relying on more than 1,500 sources. Browse GeoPostcodes datasets and download a free sample here.
Let’s compare eight popular tools for mapping sales territories based on key features, customizability, integration, UI and UX, data collection, and stats.
Why Invest in Sales Territory Mapping Software?
Investing in sales territory mapping software offers numerous benefits. It enhances decision-making by providing valuable insights into sales territories, improves customer management, and boosts overall sales team performance. Additionally, it streamlines administrative tasks, allowing sales reps to focus on what they do best – selling.
The Benefits of Using Sales Territory Mapping Software in Business
Sales territory mapping software is not just a tool for creating and assigning territories. It is also a powerful tool for improving various aspects of your business, such as sales efficiency, customer experiences, and business growth. Here are some benefits of using sales territory mapping software in your business.
Increasing sales efficiency
One of the main benefits of sales territory mapping software is that it can help you increase your sales efficiency. Sales efficiency is the ratio of revenue generated to the resources spent on sales activities. By using sales territory mapping software, you can optimize your sales efficiency in several ways, such as:
- Reducing travel time and costs: Sales territory mapping software can help you plan the best routes for your sales reps to visit their customers and prospects. This can save you time, money, and fuel, and also reduce the environmental impact of your sales activities.
- Improving productivity and performance: It can help you monitor and measure the productivity and performance of your sales reps and territories. You can track key metrics, such as sales volume, revenue, quota attainment, customer satisfaction, etc. You can also identify areas of improvement and provide feedback and coaching to your sales reps.
- Enhancing collaboration and communication: Sales territory mapping software can help you improve collaboration and communication among your sales team members. You can share data, insights, and best practices with your colleagues. You can also coordinate your efforts with other departments, such as marketing, customer service, and operations.
Increasing your sales efficiency can generate more revenue with fewer resources, improve your profitability, and gain a competitive advantage in your market.
Enhancing customer experiences
Customer experiences are perceptions and emotions when interacting with your brand, products, or services. By using sales territory mapping software, you can improve your customer experiences in several ways, such as:
- Personalizing your solutions: You can segment your customers and prospects based on various criteria, such as location, industry, size, behavior, preferences, and more. This can help you tailor your solutions to their specific needs and expectations.
- Delivering timely and relevant messages: Deliver timely and relevant messages to your customers and prospects. You can use data-driven insights to create targeted campaigns and offers that resonate with them. You can also use real-time data to promptly respond to their queries and issues. You can also take into account their time zone.
- Building long-term relationships: Sales territory mapping software can help you build long-term relationships with customers and prospects. You can use historical data to understand their past interactions and transactions with your brand. You can also use predictive analytics to anticipate their future needs and preferences.
By enhancing your customer experiences, you can increase your customer satisfaction, loyalty, and retention. You can also generate more referrals, testimonials, and reviews from your happy customers.
Fostering business growth
A final benefit of sales territory mapping software is that it can help you foster your business growth. Business growth is the increase in your business’s size, scope, or impact over time. By using sales territory mapping software, you can foster your business growth in several ways, such as:
- Identifying new opportunities: Sales territory mapping software can help you identify new opportunities for business growth. You can use geographic data and spatial analysis to discover untapped markets or regions where you have a competitive edge. You can also use demographic data to find new segments or niches that match your ideal customer profile.
- Expanding into new territories: Sales territory mapping software can help you easily expand into new territories. You can use data-driven criteria to create and assign new territories based on their potential and profitability. You can also use data-driven insights to adapt your strategies and tactics to the local conditions and preferences.
- Innovating new solutions: Sales territory mapping software can help you innovate solutions for your customers and prospects. You can use data-driven feedback to understand their pain points and challenges. You can also use data-driven creativity to develop new products or services that solve their problems or fulfill their desires.
You can increase your market share, revenue, and profitability by fostering your business growth. You can also achieve your long-term vision and mission for your business.
Key Features to Look For in Quality Sales Mapping Software
When selecting sales mapping software, it’s essential to consider key features that align with your business needs. These include:
Integrations with Existing CRM Systems
A good sales mapping tool should seamlessly integrate with your existing CRM system, ensuring smooth data flow and efficient management of customer information.
Flexible Route Planning
Route optimization is crucial for field sales teams. The software should offer flexible route planning features to maximize efficiency and reduce travel time.
Effective Territory Management Capabilities
The ability to manage and adjust territories dynamically is vital. Look for software that provides robust territory management tools to keep up with changing market conditions.
Reporting and Analysis Tools
Detailed reporting and analysis tools are essential for tracking performance and identifying areas for improvement. Ensure the software offers comprehensive analytics capabilities.
Best sales territory mapping software
Let’s compare eight popular tools for mapping sales territories based on key features, customizability, integration, UI and UX, data collection, and stats.
Badger Maps
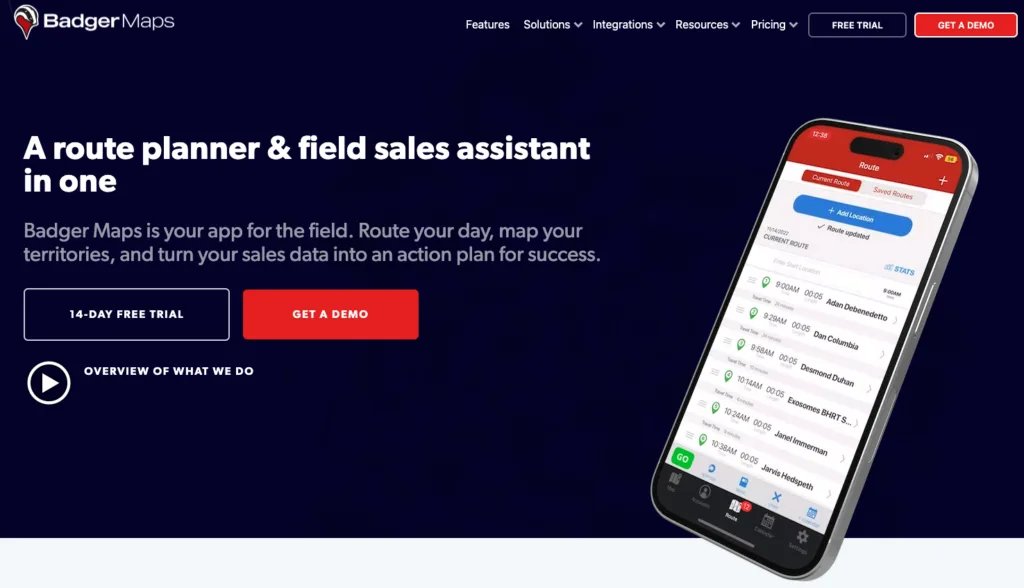
Badger Maps is an automatic territory management solution that uses advanced GIS technology to map sales territories.
Badger Maps is cloud-based with a simple drag-and-drop interface and fairly intuitive navigation. Its data visualization tools, such as heat maps and territory reports, let sales reps analyze data more effectively. Using the Lasso feature, users can generate routes by circling a group of points on a map; with Route Stats, reps get important insight into routes, such as travel time and mileage.
Users can customize maps, routes, and other elements using custom fields, forms, and lists, set up custom notifications and triggers, and create custom reports and routing algorithms.
Integration with popular CRM systems, including Salesforce, Pipedrive, and Zoho CRM, offers a comprehensive view of sales data, while calendar syncing with Google Calendar, Outlook, and iCal enables efficient appointment scheduling and route planning. With iOS and Android mobile apps, sales reps can access customer data, update statuses, and navigate routes while on the move.
Badger Maps has a few different pricing options:
- A free fourteen-day trial for the Business plan, which starts at $58 per month per user billed annually or $69 per month per user per month
- The Enterprise plan, which is $95 per month per user billed annually or $109 per month per user per month
Xactly AlignStar
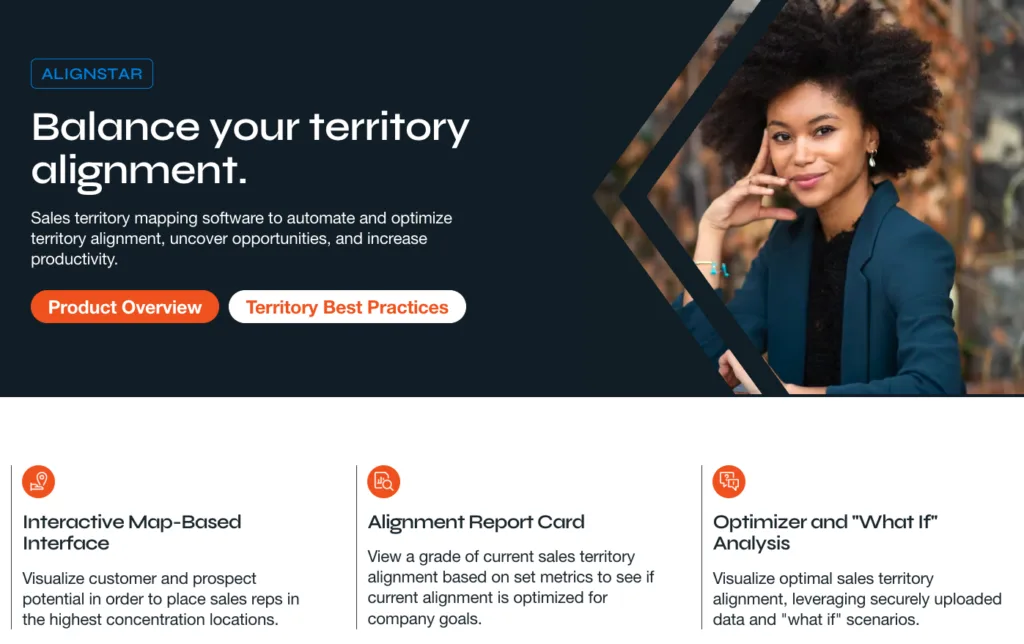
Xactly AlignStar is a cloud-based sales territory mapping solution that automates and optimizes territory design and planning. Designed specifically for large to medium-sized organizations, AlignStar enables sales teams to design sales territories by geographic areas, visualize customer prospects and data, and identify territories with the highest sales potential.
Xactly AlignStar has purpose-built features that allow the sales team to grade the current sales territory alignment based on preset metrics and optimize sales territory alignment according to “what if” scenarios. They can set quotas and use customizable dashboards, fields, and formulas to track performance. Heat maps and bar charts help them discover and understand patterns in data, and custom reports are easy to create with advanced filtering and reporting tools. Xactly’s API enables developers to create and integrate custom features with existing business systems.
AlignStar integrates with CRM, ERP, and accounting tools like Salesforce, Microsoft Dynamics, QuickBooks, Marketo, and Power BI to provide a complete view of sales performance in one tool.
AlignStar offers quote-based fixed plans with pricing information available upon request.
AlignMix

The AlignMix sales territory mapping tool is most often used by sales teams in the pharmaceutical industry and related sectors where deep historical analysis is beneficial to accessing changing market dynamics in cases such as patent loss. Key features include:
- Sales territory design
- Territory optimization
- Sales rep assignment
- Data visualization
- Historical data analysis
- Mobile access
- Geocoding
Via its intuitive drag-and-drop interface, AlignMix allows the field sales team to create, manage, and optimize territories and organize geographic areas across teams. With the Touch Align tool, they can create territories with the click and hold of a mouse, just like “digital finger painting,” according to their site.
Integrate AlignMix with Salesforce to create more informed territory models and export data to PDF, PPT, KML, Excel, Google Maps, or Tableau. Thematic maps highlight geographic hotspots and let the sales team discover hidden opportunities within a territory. Individual geographic variables are easy to see in the chart view. AlignMix offers real-time updates and customizable data filters by customer location, sales rep, and date range.
Pricing for AlignMix Professional for in-house use is $2,000 per user per year, with the consulting license at $6,000 per user per year.
eSpatial
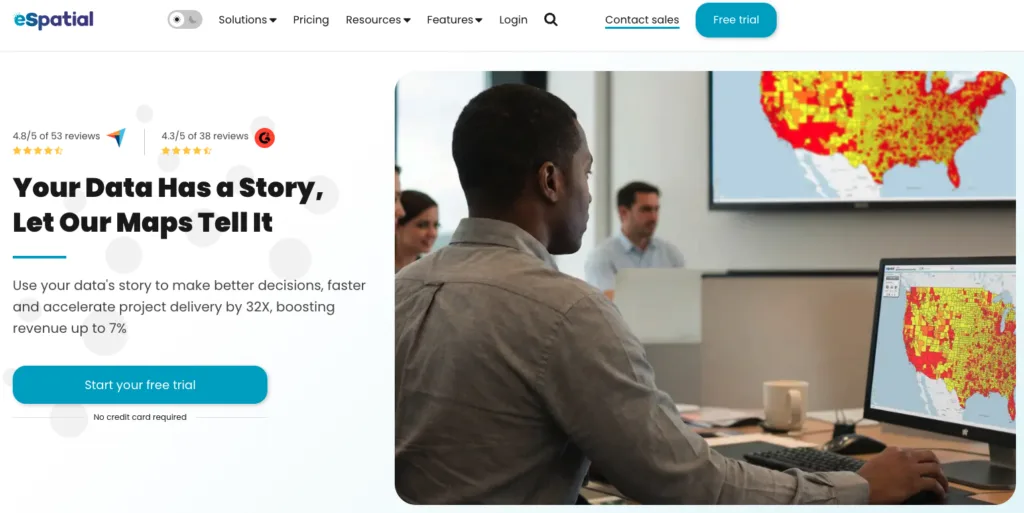
eSpatial is a sales mapping solution suitable for sales teams of all sizes. It offers several key features for sales territory mapping in three products:
- eMapping is a suite of data visualization tools with advanced styling options and performance analysis.
- eRouting uses algorithms to plan and optimize routes. Sales reps can schedule up to 20 routes per day.
- eTerritory offers geo-analytical territory optimization capabilities that allow sales teams to plan, design, realign, and optimize territories.
Another simple drag-and-drop interface, eSpatial, enables users to upload data and create map layers easily. eSpatial offers several customization features, including:
- The ability to display different types of data in separate layers
- Tools such as distance calculation and proximity analysis for spatial analysis
- The ability to create custom scripts using Python, R, and VBA
eSpatial integrates easily with Salesforce CRM and uses a RESTful API to integrate with other software systems. You can also upload data from various sources, including Excel spreadsheets, CSV files, and shapefiles.
Pricing starts at $1,495 per year for a single user and goes up to $7,995 per year for a complete solution with mapping, routing, and territory features. You can add more users, but you need to contact them directly for that pricing.
Microsoft Excel
Microsoft Excel is a powerful tool that probably needs no introduction. It allows you to store, organize, analyze, and visualize large amounts of data quickly and easily. Its variety of charting and formatting features allow you to present sales data clearly and visually appealingly.
Sales territory mapping on Excel
Spreadsheets allow users to manage and analyze sales territory, customer, and sales data. At the same time, built-in charting and graphing tools let them create visual representations of the data for identifying trends and patterns. Excel also offers heat map capabilities for visualizing sales data by geographic location and pivot tables for summarizing and analyzing sales data.
Excel’s charting and pivot tables enable sales teams to identify patterns, trends, and outliers in sales data; you can even add geocode geographic coordinates with add-ons such as Excel Geocoder. Customizable templates such as Map Chart let you create maps quickly and easily, and of course, Excel is well-known for its macros and scripts that can automate repetitive tasks.
Excel integrates easily with Microsoft Dynamics 365 and tools like Power BI and Tableau to offer more advanced visualization and analysis capabilities. Several CRMs—including Salesforce, Hubspot CRM, and Zoho CRM—offer Excel add-ins, web connectors, or any low-code tool (Zapier, Make…) integration to synchronize data between Excel and the CRM in real time.
You can import data easily from a wide variety of sources, including other spreadsheets, CSV files, databases, web pages, and external APIs using Excel’s standard import features as well as add-ins such as Power Map, Power Query, and Power BI for creating 3D maps, custom reports, and interactive dashboards. Pivot tables, filters, and conditional formatting allow you to group and summarize data by criteria such as sales territory, customer, or product.
Excel is available as part of the Microsoft 365 Business Subscription. For a Premium subscription, pricing starts at $22 per user per month, while Microsoft 365 Business Standard starts at $12.50 per month.
Maptive
If you are looking for powerful and easy-to-use sales mapping software, Maptive might be your best choice. Maptive is a cloud-based mapping tool that allows you to create custom maps from your sales data in minutes. You can upload your data from Excel, Google Sheets, or any CRM system, and Maptive will automatically geocode it and plot it on a map. You can then customize your map with various features, such as:
- Territory mapping: You can create and manage sales territories based on geographic boundaries, such as zip codes, counties, states, or countries. You can also balance your territories based on sales data, such as revenue, customers, or leads. Maptive lets you assign sales reps to each territory and track their performance and progress.
- Route optimization: You can plan the most efficient routes for your field sales teams, saving time and money on travel. You can optimize your routes based on distance, time, or priority and add multiple stops and waypoints. Maptive also integrates with Google Maps to get turn-by-turn directions and real-time traffic updates.
- Heat mapping: You can visualize your sales data on a map using color-coded regions that show the density or intensity of a certain variable, such as sales volume, customer satisfaction, or market share. You can use heat maps to identify hotspots and coldspots and discover new opportunities and trends.
- Data analysis: You can analyze your sales data using various tools, such as filters, charts, graphs, and reports. You can also use Maptive’s built-in geocoding and address validation features to ensure the accuracy and quality of your data.
Maptive is a versatile and flexible sales mapping software that can help unlock your sales potential and grow your business. You can access Maptive from any device, share your maps with your team and clients, and export your maps and data in various formats. You can also try Maptive for free for 10 days or a 45-day pass for $250—the pro plan ranges from $1250 to $2500 per year.
Spotio
Spotio is another sales mapping software designed for field sales teams, especially those who do door-to-door canvassing. Spotio helps you capture and track leads, manage sales territories, optimize sales routes, and analyze sales performance. Some of the key features of Spotio are:
- Lead management: You can import your leads from any source, such as Excel, Google Sheets, or CRM systems, and view them on a map. You can also add new leads manually or automatically by using Spotio’s lead machine feature, which generates leads based on your ideal customer profile. You can filter, sort, and update your leads with custom fields and statuses.
- Sales tracking: You can track and measure the sales activity and results of your field sales team, such as calls, visits, texts, emails, meetings, opportunities, wins, and revenue. You can also use Spotio’s dashboards, reports, and leaderboards to visualize your sales data and identify trends, insights, and areas for improvement.
Spotio is a cloud-based sales mapping software that works on any device, online or offline. You can share your maps and data with your team and clients and export them in various formats. You can also integrate Spotio with your CRM system, such as Salesforce, HubSpot, or Zoho, and sync your data automatically. You can choose from different pricing plans upon request.
Google Maps
Google Maps is one of the world’s most popular and widely used mapping services. It provides various features like street view, directions, and real-time traffic data. However, Google Maps is not a sales mapping software; it has limitations regarding sales territory management and optimization. Here are some of the drawbacks of using Google Maps for sales mapping:
- Limited customization: Google Maps does not allow you to customize your map with your data, such as sales volume, customer satisfaction, or market share. You cannot create heat maps, charts, graphs, or reports to visualize and analyze your sales data. You also cannot filter, sort, or update your data with custom fields and statuses.
- Inability to handle complex sales territory management needs: Google Maps does not allow you to create and manage sales territories based on geographic boundaries, such as zip codes, counties, states, or countries. You cannot balance your territories based on sales data, such as revenue, customers, or leads. Google Maps does not let you assign sales reps to each territory and track their performance and progress.
- Lack of integration with CRM systems: Google Maps does not integrate with your CRM systems, such as Salesforce, HubSpot, or Zoho, and syncs your data automatically. You have to manually import and export your data between Google Maps and your CRM system, which can be time-consuming and error-prone.
- Lack of collaboration and accessibility features: Google Maps does not allow you to share your maps and data with your team and clients and export them in various formats. You cannot access Google Maps from any device, online or offline, and collaborate with your team in real time.
Google Maps is a basic mapping service that can help you visualize customer locations and plan sales routes. However, it is not a sales mapping software and cannot help you with sales territory management and optimization. You need more powerful and comprehensive sales mapping software to unlock your sales potential and grow your business.
What type of Sales Data do you need
First and foremost, you require data on your sales team’s performance, including sales revenue, customer acquisition rates, and individual salesperson performance metrics. Additionally, customer data is vital, encompassing information on customer demographics, preferences, purchase history, and contact details.
Geographic data, such as location coordinates and customer addresses, is crucial for effectively visualizing and analyzing your sales territories. Market data, like competitor locations, market trends, and potential growth areas, also plays a pivotal role in optimizing your sales strategies.
By integrating these types of sales data into your territory mapping software, you can gain valuable insights to allocate resources efficiently, identify growth opportunities, and enhance overall sales performance.
How to map my sales territories
Start by defining your target market and understanding your customer base. Collect and organize sales data, including customer locations, sales performance metrics, and market trends.
Utilize a Geographic Information System (GIS) or sales territory mapping software to visualize this data on a map. Analyze the information to identify clusters of customers and areas with growth potential. Based on these insights, create well-defined territories with clear boundaries, ensuring equitable distribution of customers and sales opportunities among your sales team.
Monitor and adjust your territories to adapt to changing market dynamics and customer demands. Mapping your sales territory empowers your team to work more efficiently, improve customer engagement, and achieve better sales results.
Final Thoughts and Conclusion
Sales territory mapping software is a powerful tool to help you design, optimize, and manage your sales territories.
You can gain insights into your market, customers, and competitors using geographic data and visualization. You can also improve your sales efficiency, productivity, and profitability.
Choosing the right software for your business needs
However, not all sales territory mapping software is created equal. There are many factors to consider when selecting and implementing the right software for your business needs, such as:
- The user interface: The software should be easy to use and navigate, even for non-technical users. It should also be intuitive and responsive, providing clear feedback and guidance to the user.
- The feature set: The software should offer relevant and useful features for your business goals and needs. It should also be comprehensive and robust, covering all the aspects of sales territory mapping you require.
- The customer support and service quality: The software provider should offer responsive and reliable customer support and service quality. It should provide timely and accurate answers and solutions to your questions and issues.
- The pricing: The software should offer fair and transparent pricing that matches your budget and expectations. It should also provide a free trial or a demo to let you test the software before buying it.
- The integration: The software should integrate seamlessly with your existing systems, such as CRM, ERP, or Excel. It should also allow you to access and use your software from any device or location.
You can check the websites of different sales territory mapping software to compare their features, advantages, and drawbacks. You can also read the reviews of other users on third-party platforms, such as Capterra or G2, to see what they think about the software’s usability, functionality, support, and service.
The role that these software play in the growth and success of your sales strategy
Sales territory mapping software can play a vital role in the growth and success of your sales strategy. By using sales territory mapping software, you can:
- Create and assign territories based on various criteria, such as geography, demographics, sales potential, customer behavior, etc.
- Monitor and measure the performance of your territories and sales reps based on key metrics, such as sales volume, revenue, quota attainment, customer satisfaction, etc.
- Improve the efficiency and effectiveness of your territories by using data-driven algorithms and models.
- Adjust your territories according to changing market conditions or business objectives.
- Ensure a fair distribution of workload and opportunity among your sales reps.
- Identify new prospects or customers within or outside your territories.
- Plan the best routes for your sales reps to visit their customers or prospects.
- Share and communicate data and insights with your team members and other stakeholders.
Doing so can increase your sales efficiency, productivity, and profitability. You can also enhance your customer satisfaction, loyalty, and retention. You can also generate more referrals, testimonials, and reviews from your happy customers. You can also increase your market share, revenue, and profitability. You can also achieve your long-term vision and mission for your business.
In conclusion, sales territory mapping software is a must-have tool for any modern sales organization that wants to gain a competitive edge in their market.
By choosing the right software for your business needs, you can leverage the power of data visualization, analytics, and optimization to make smarter and faster decisions. You can also use sales territory mapping software to improve your sales strategy and grow your business.
Get Accurate Territory Data with GeoPostcodes
These eight sales territory mapping software solutions work best with accurate geolocation data.
Yet, they don’t always embed worldwide accurate and up-to-date location data. For example, eSpatial provides location data such as latitude and longitude coordinates for postal codes and addresses. However, eSpatial focuses on data for the United States.
Similarly, AlignStar provides sales-specific data for optimizing territories and sales strategies, but you may not find the right type of location data to accommodate your needs.
To fully leverage territory mapping solutions, you must turn any location assignments you use (like postal codes, counties, or localities) into coordinates before using the tool.
Building an accurate geolocation dataset across multiple countries is time-consuming and costly. It also has to be maintained. Postal codes are frequently updated, so your sales territories will get outdated if you omit to refresh the underlying mapping data.
This is where GeoPostcodes comes in. As the leading provider of postal geo-referenced data, GeoPostcodes offers businesses the largest, most comprehensive, and up-to-date global postal code database with extensions to provide street-level data and postal code and administrative boundaries.
GeoPostcodes’ data offers precise and accurate data for territory mapping, especially if your sales coverage is based on discrete local divisions like postal codes. To assign sales reps to cover specific postal codes or counties, you can use GeoPostcodes’ datasets to transform these locations into coordinates or boundary polygons.
Similarly, GeoPostcodes’ data can be used to build accurate heat maps or choropleth maps that you can use in territory maps or other GIS applications. You can use it to verify addresses before sales calls, plan the fastest route between customer visits, or help create better shipping estimates.
Get full access to our data, product updates, and support with GeoPostcodes’ annual license. Request a quote for the perfect fit for your needs!
Does Salesforce have a mapping tool?
Salesforce offers a mapping tool called Salesforce Maps. This tool is designed to help organizations visualize and optimize their sales territories. It allows users to create, manage, and analyze sales territories with interactive maps, enabling better decision-making, route planning, and customer engagement.
Does Microsoft have mapping software?
Microsoft used to offer mapping software known as “Microsoft MapPoint.” However, it’s essential to note that MapPoint has been discontinued, and Microsoft no longer provides updates or support. As an alternative, Microsoft’s Power BI platform offers mapping and visualization capabilities, allowing users to create interactive maps and analyze data geographically.