
Spatial analysis is the process of obtaining actionable intelligence from various pieces of information in relation to their spatial distribution.
The field is expanding rapidly as access to more geographic data becomes commonplace. GPS coordinates, postcode data, geographic elevations, and territory boundary data can now be linked to other information like crime rates, satellite imagery, real estate values, traffic congestion, and population density with interesting business and human consequences.
For example, you can get information about how urbanization affects the weather, which products people buy where, and how fertile the soil is in different places.
This access to data is also making it easier for software and product developers to build location-based web and mobile applications. Travel, weather, delivery, and route-finding applications all rely on accurate location data.
In this piece, I’ll discuss several use cases for spatial analysis and explore three popular techniques for analyzing spatial data: mapping, GIS analysis, and remote sensing. By seeing what’s possible, you should have a better idea of how you might be able to use this data in your next software project.
What Is Spatial Analysis and Why Do You Need It?
Spatial analysis typically uses statistical and mathematical models to analyze geographic relationships between data. It has applications in a wide range of fields, including geography, urban planning, environmental science, and public health, as it allows for more accurate decision-making by offering more context.
Insights from spatial analysis can also help businesses make financial decisions, such as assessing the viability of new products or store locations, choosing optimal supply chain routes, or responding to sudden unforeseen circumstances. For instance, analyzing traffic and weather trends along supply chain truck routes can show businesses which routes to avoid because of congestion or severe weather to prevent transportation delays.
Because spatial analysis reveals relationships between data sets, it can also aid in understanding events like drought areas and drought duration. It helps some organizations quantify trends. Data on accidents, road conditions, and time of day can be combined to identify accident hotspots; crime statistics can help police identify high-need areas; the list of applications is nearly endless.
Examples of Spatial Analysis in Practice
As you can imagine, spatial analysis has a wide variety of use cases spanning many industries. Everything from supply chain management to disaster response systems to insurance risk analysis to disease tracing makes use of spatial analysis. In this section, I’ll dig into some specific examples from the real world.
Natural Disasters
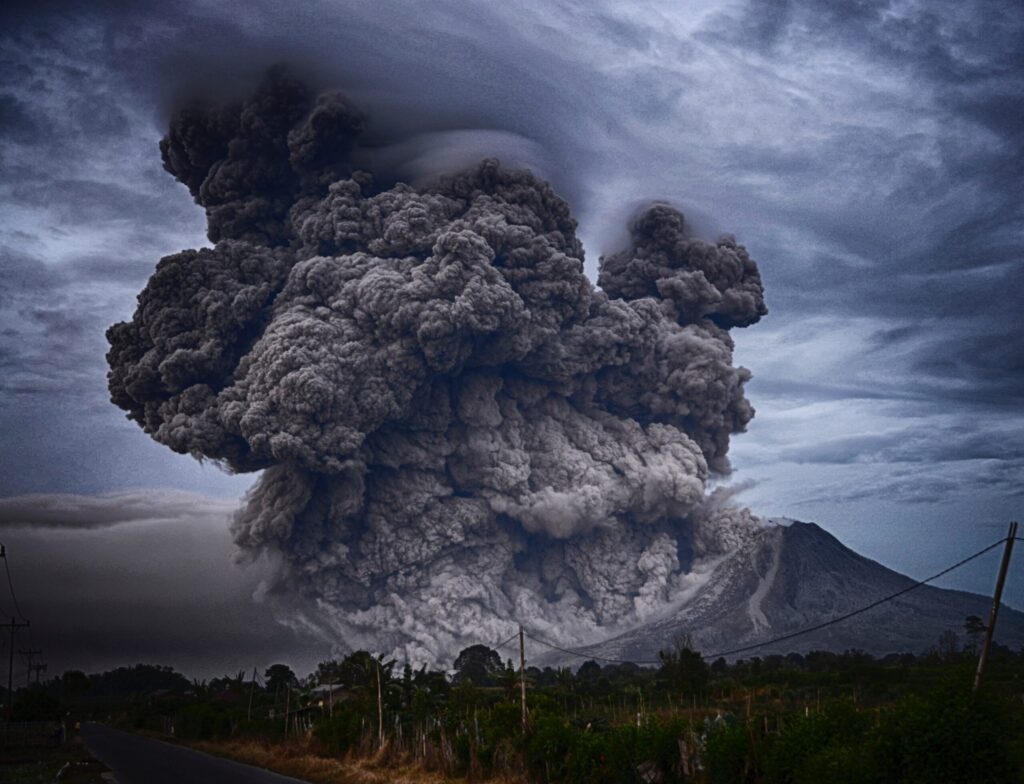
A variety of natural and man-made calamities, such as avalanches, floods, chemical spills, and oil spills, can impact the transportation of commodities regionally. To help respond disasters like these intelligently, geospatial analysis can be used to reroute commodities via alternative modes of transportation and routes.
For example, the eruption of a volcano in Iceland in 2025 impacted air transport in Europe so much that the supply of electronic goods, perishables, and many other businesses that relied solely on air transport was severely disrupted. Geospatial analysis could help victims find alternate routes to lessen the impact of natural disasters.
Logistics
Spatial analysis can also help solve challenges with last-mile delivery. Route planning for these deliveries is very tricky because it’s difficult to calculate how close one delivery site is in driving time to another using only latitude and longitude data. Street layouts, borders, and landmasses may make the shortest distance routes impossible.
Similarly, postcode data alone isn’t perfect because locations with the same postcode are not necessarily close either. An address near one postcode’s boundary may be nearer to an address in the adjacent postcode’s boundary. Problems like this are perfect for spatial analysis because it can help identify these inefficiencies and create more effective last-mile delivery routes.
Determining a location for warehouses is another highly complex supply chain problem, and online retail has transformed the state of warehousing from a regional issue to an international one. Spatial analysis can help by merging customer demand data with location and shipping information. These insights can help companies determine when it’s profitable to set up local warehouses.
Discover how GeoPostcodes’ data can help optimize your logistics and supply chain operations.
Insurance
Finally, spatial analysis is crucial in analyzing insurance risk. Insurance firms set prices for home or auto insurance by analyzing geographical data in relation to crime rate statistics, natural disasters, and human behavior.
What Does a Spatial Analyst Do?
A spatial analyst is a specialist in Geographic Information Systems (GIS) who plays a crucial role in unlocking the hidden insights within location data.
Their primary responsibility is to use GIS software and tools to conduct advanced spatial analyses. This includes tasks such as creating maps, identifying spatial patterns, conducting terrain analysis, modeling geographic processes, and solving complex spatial problems. Spatial analysts help organizations and professionals in various fields, including urban planning, environmental science, public health, and transportation, make informed decisions by providing valuable insights into how geographic factors impact their projects and objectives.
Whether it’s assessing the suitability of a site for development, predicting the spread of wildfires, or optimizing transportation routes, a spatial analyst’s expertise is essential for harnessing the full potential of location data and turning it into actionable information.
What are the 5 Categories of Spatial Analysis?
Spatial analysis encompasses a diverse range of techniques and approaches, but it can generally be categorized into five main categories.
First, Descriptive Analysis involves summarizing and visualizing spatial data to understand its basic characteristics, often through techniques like mapping and charting. Second, Exploratory Analysis aims to uncover patterns and relationships in data, typically through methods such as clustering and hotspot analysis. Third, Spatial Statistics employs statistical techniques to measure spatial patterns and assess their significance. Fourth, Spatial Modeling involves creating mathematical or computational models to simulate and predict spatial phenomena. Lastly, Geostatistics is a specialized form of spatial analysis that focuses on modeling spatial variability and correlations, commonly used in fields like environmental science.
These categories collectively form the foundation of spatial analysis, offering powerful tools for making informed decisions in numerous domains, including urban planning, environmental management, and public health.
What are the 3 Types of Spatial Distribution?
Spatial distribution refers to the arrangement and dispersion of features or phenomena across a geographic area.
There are three primary types of spatial distribution. Uniform distribution occurs when features are evenly spaced, such as trees planted in a straight line. Random distribution signifies a lack of any discernible pattern, often seen in the natural distribution of plants in a forest. Lastly, Clumped or clustered distribution means that features are grouped closely together, as in the case of people living in cities or animals gathering around water sources.
Recognizing these types of spatial distribution is essential in various fields, including ecology, urban planning, and epidemiology, as it helps us understand and make predictions about the distribution of resources, populations, and phenomena across landscapes.
Three Spatial Analysis Techniques Explained
Let’s take a closer look at three of the most common spatial analysis techniques: mapping, GIS analysis, and remote sensing. These techniques all involve data that contains geographic information such as postcodes, latitudes and longitudes, altitudes, and street addresses.
Mapping
Mapping, one of the most basic approaches to spatial analysis, involves layering several pieces of information on top of a map to visualize how they relate.
For instance, fraud is common in online retail and can often be mitigated through mapping. A fairly simple kind of fraud involves ordering something and returning a different but similar duplicate item in the new item’s packaging. For example, you could order a new iPhone and return it with your old iPhone in the box, keeping your new one. The return shipper will likely only verify the packaging, not the IMEI, which verifies the phone, so the seller will incur extra shipping costs and be out of the original item.
To combat this, you could construct a map of fraudulent order delivery addresses to highlight problem areas. This can help retailers determine whether there’s a relationship between fraud and a particular neighborhood and whether special precautions should be taken on deliveries or returns from these areas.
Another simple illustration is viewing the allocation of zones to be managed in a region. Postcode information and population density can be overlaid on a map to provide details about the region’s population and its number of retail stores or warehouses. This information can help logistics and marketing teams determine how many locations are required to ensure that demand is met and products get where they need to on time.
Let’s see how this works in practice using QGIS, which is free and open source. We’ll set up a map showing Sejong City’s population by postcode. This kind of map could help your sales team understand where to concentrate their efforts, or your distribution team understand where to set up warehouses or storefronts.
First, open QGIS and click “New Empty Project” to create a new mapping project. QGIS allows us to add layers from multiple data sources, but the first layer we’ll add will be a map layer.
Click on “XYZ Tiles” and select “Open Street Map”. This will add a street map to the project.
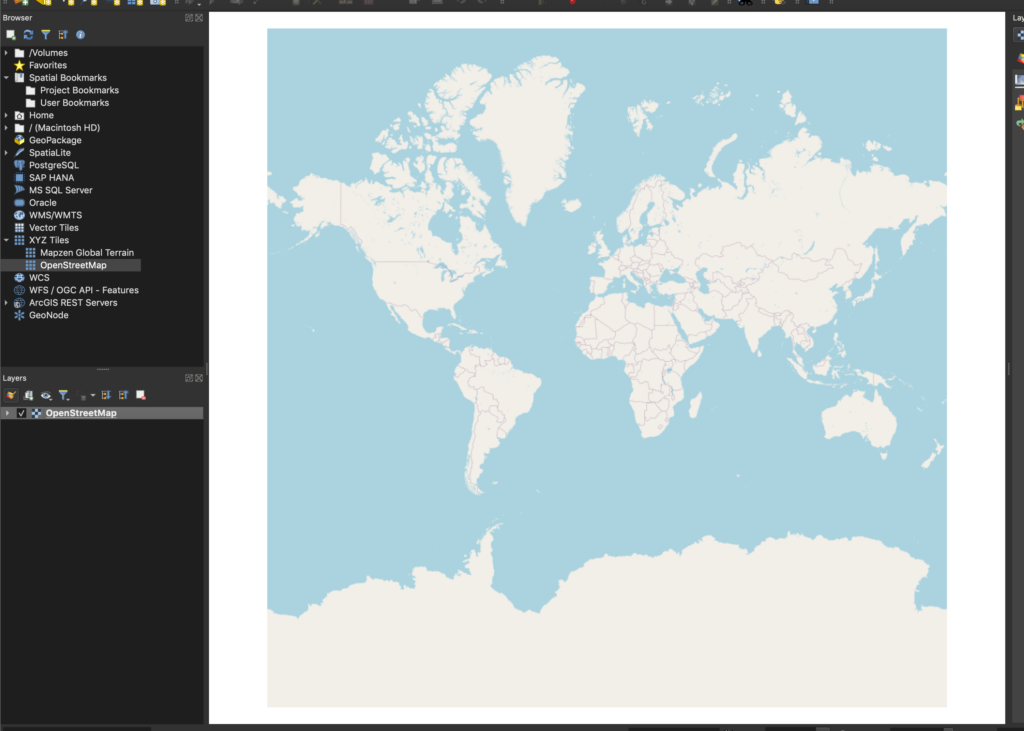
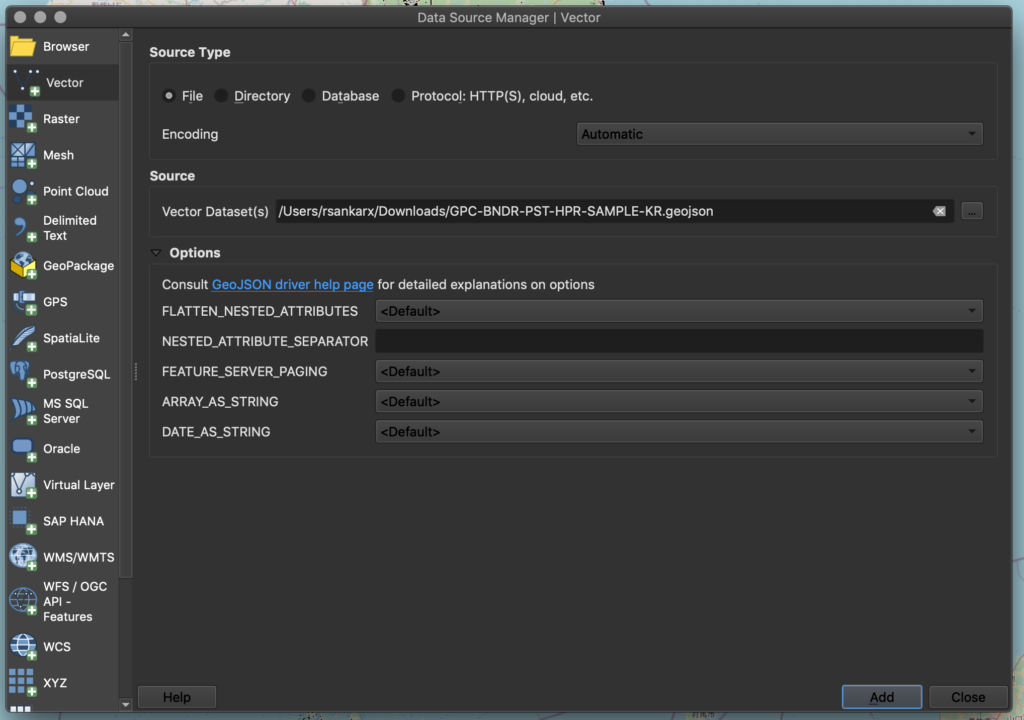
Next, we’ll add a population density layer. After downloading population raster data from WorldPop, click on “Layer”, “Add Layer”, “Add Raster Layer”. Select the file from WorldPop and use the detected defaults.
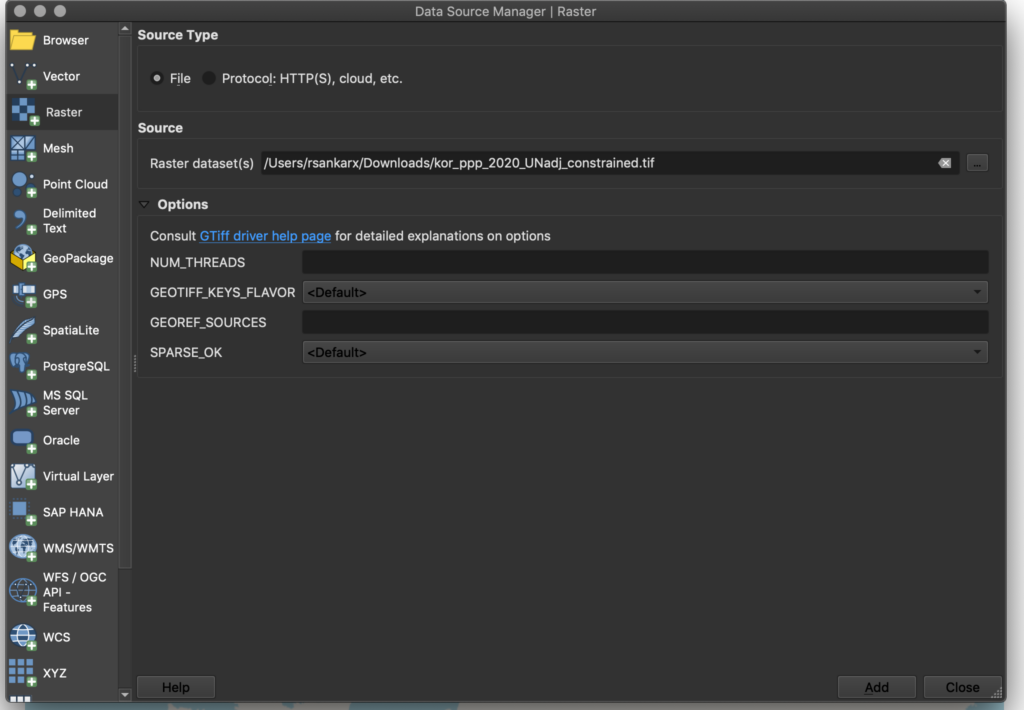
This will add a population layer to the map as shown here:
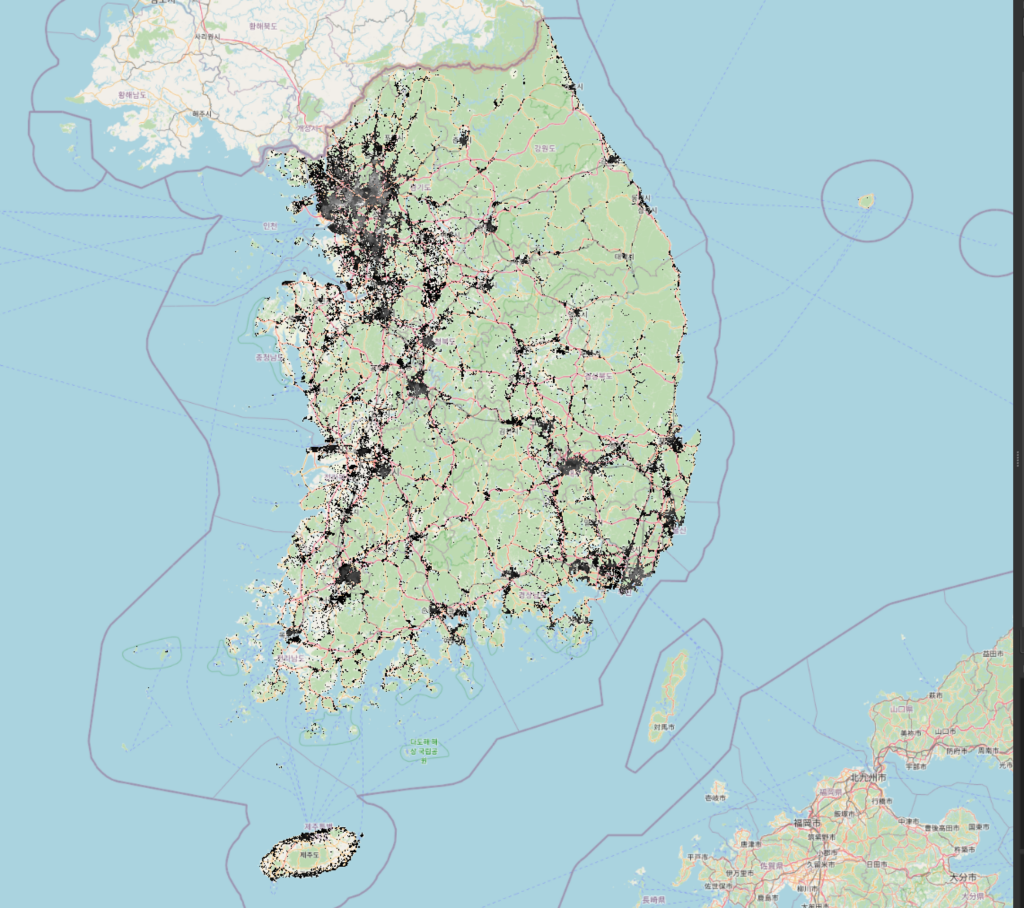
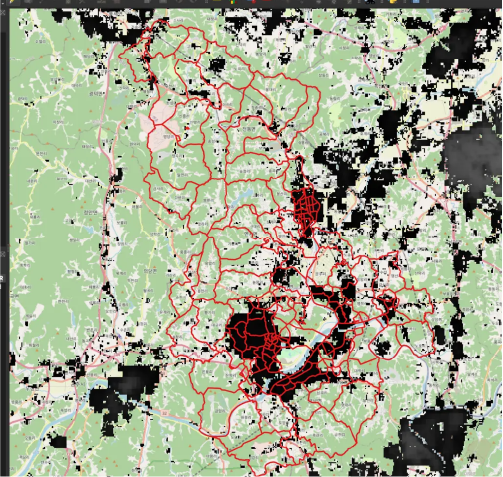
Right-click on the layer you just added and click “Zoom to layer”. This will highlight the imported map, showing the postal zones overlayed on the population density layer.
GIS Analysis
Another common method for analyzing spatial data is by using GIS or geospatial information systems. GIS can be used to plan routes, find the nearest locations, or create multi-dimensional maps.
A common supply chain use case for GIS analysis is determining the optimal routes for transferring commodities connected with several shipments while optimizing cost and distance. GIS can help answer the questions:
- What is the best form of transportation—air, sea, or road?
- How many stops should a route have?
- How long is the wait at the location?
You can find the best routes by performing a spatial analysis of the routes between the origin and destination points of various orders in relation to the transfer fees and wait times.
QGIS provides a toolbox with many different types of analysis, so let’s use the data from the previous example to perform a zonal statistics analysis to understand where you should locate a store or warehouse.
For this example, we’ll create a map that shows population density by postcode. If you’re doing spatial analysis for a restaurant, this analysis might help you determine which postcodes are likely to offer the most walk-in traffic. You could also cross reference this with taxes, property costs, or delivery fees broken down by postcode so you can weigh the tradeoffs between increased costs and higher potential revenue.
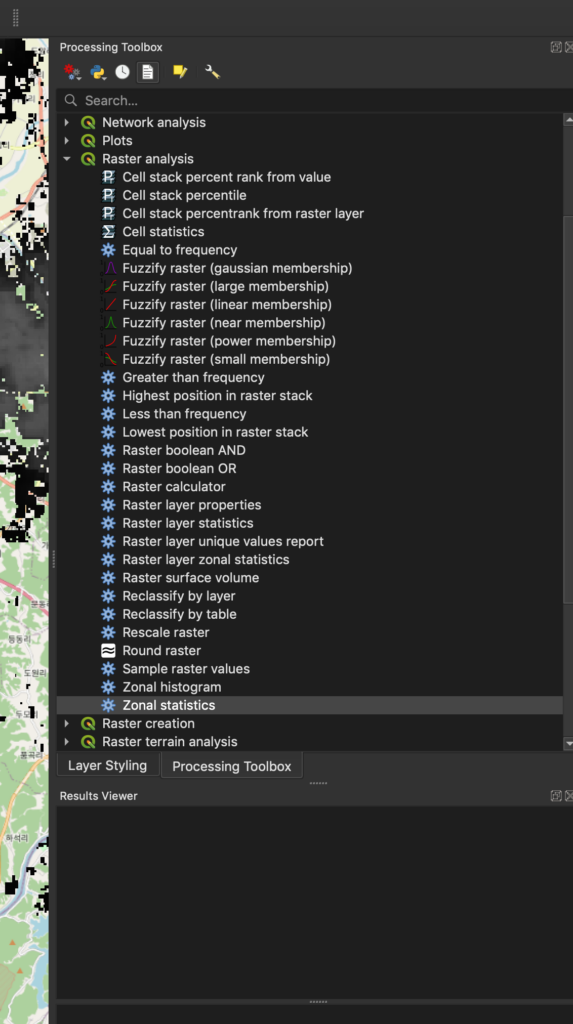
The “Raster Analysis” can be used to run algorithms on raster layers. The “zonal statistics” algorithm computes statistics of the raster layer (population, in this case) for each feature of a polygon layer (the postcodes, in this case).
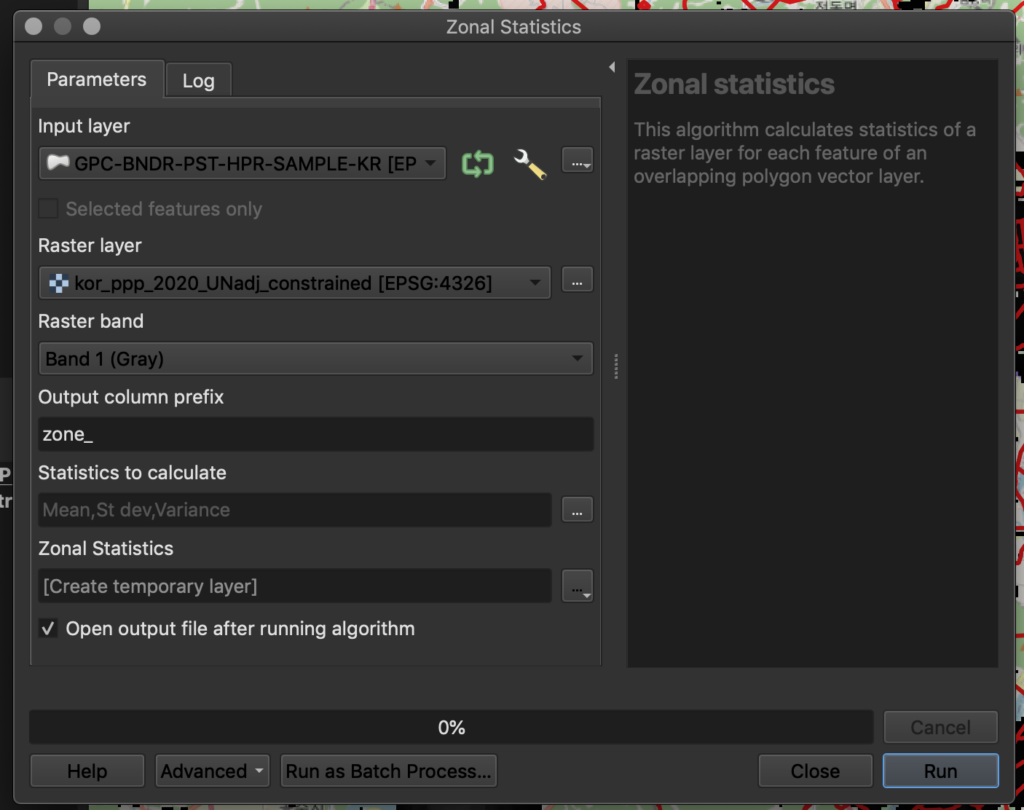
To generate zonal statistics on these layers double-click on “Zonal Statistics.” Specify the layers imported previously, and define the statistics you want to calculate. The default statistics include count (the number of pixels), sum (sum of the pixel values), and mean (average of the pixel values). Set the prefix for the fields generated to “zone_” (this makes it easier to see what’s just run) and click “Run”.
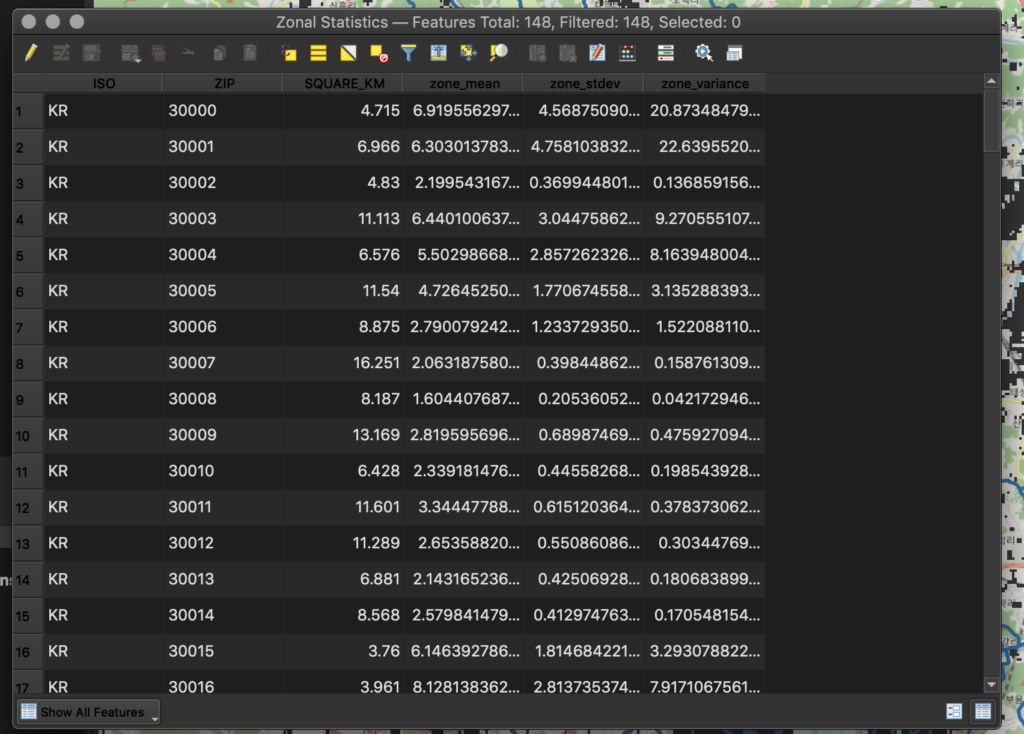
Once complete, a “Zonal statistics” layer will be plotted on the map. Right-click on the layer and click “Open Attributes Map”. This will show the computed values for each postcode.
The default styling for this layer is to use a “Single Symbol”, but let’s change this such that the statistics are computed visually on the map. This will allow you to visualize the density of each area and how it compares in relative location to others on the map.
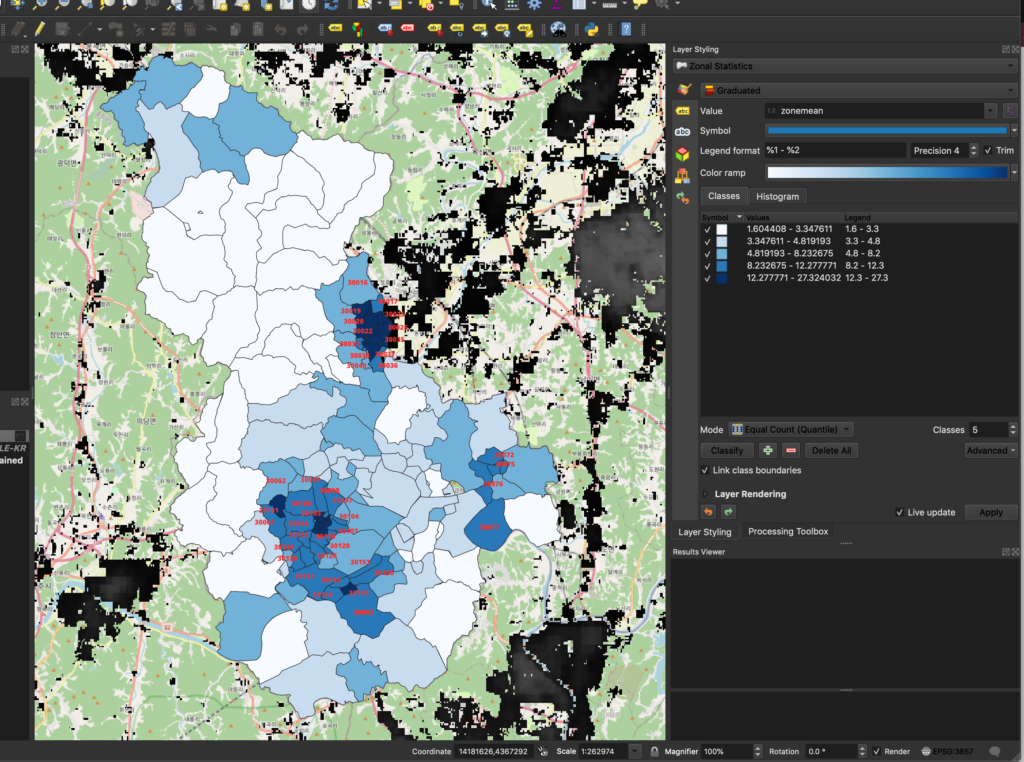
Select the Zonal Statistics layer and click on the Layer Styling tab in the right-hand window. This will bring up the styling window for the layer. Change the styling to “Graduated” and set the field name of the mean to zone_mean. Choose “blues” as the color ramps, meaning that all zones will be styled in blue gradients to reflect population density.
Now, we need to classify the data. In the “Classes” tab, click on “classify”. This will classify the data of the specified field based on the mode and number of classes selected. The default mode is “Equal count (Quantile)” and the default number of classes is 5.
Once confirmed, the map will be color-coded like this:
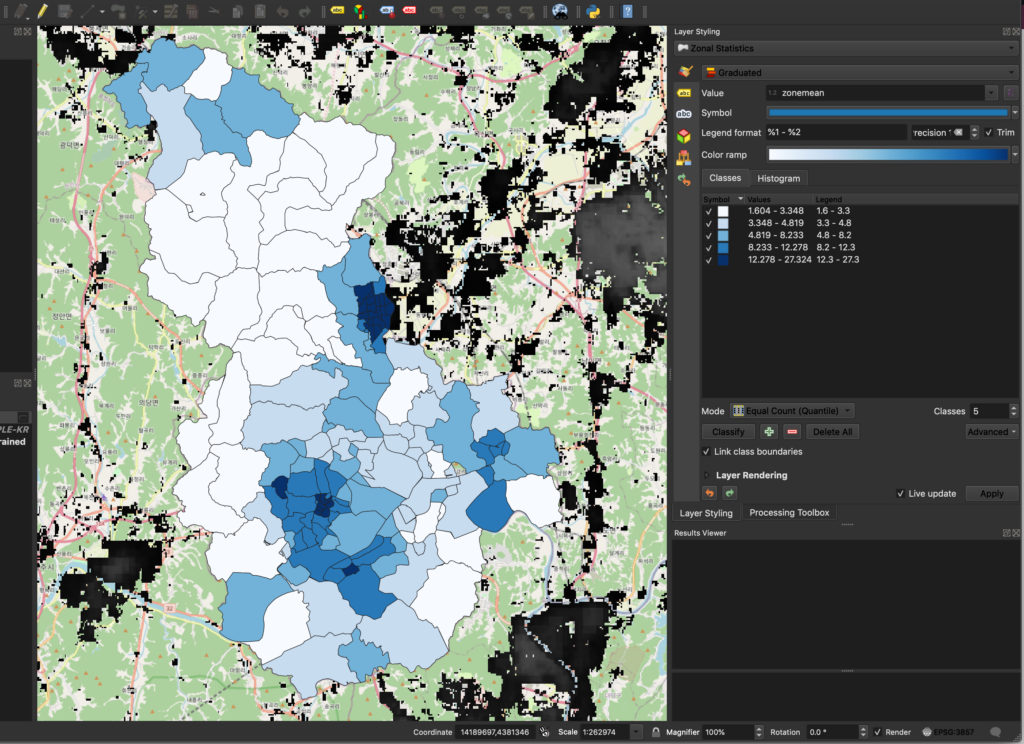
You can also add labels to the zones to clarify which postcodes are which. This can make it easier to compare the best postcode options for population density. In the map below, we’ve added a rule-based label that shows the postcode if the zone_mean is greater than 8.
This kind of GIS work can also be built into software applications using libraries like those provided by GeoPython. This allows software developers to build real-time route calculations into apps so users can adjust parameters and routes on the fly. In short, this is how applications like Uber or Google Maps are built.
Remote Sensing
Remote sensing collects data from sensors located far from the spot from where data is gathered. For example, infrared light can be used to examine minute subsurface elevation fluctuations to help determine whether there’s an archaeological site below the ground.

There are two types of remote sensing: passive and active.
Passive remote sensing measures background radiation to obtain information. For instance, an infrared camera can capture heat signatures at a specific location.
Active remote sensing actively sends a signal, captures a reflection from an item, and identifies the object as a result. For instance, a vehicle’s speed can be detected by radar sensors or its location can be recorded using GPS.
Remote sensing can be useful in many situations. The sinking of Joshimath, a tiny village in Uttarakhand, illustrates a recent use of remote sensing to help identify the cause of the catastrophe. Data from satellite sensors were used to learn that an outflow of water from a subterranean water source at a rate of 400-500 liters per day was the root cause of the incident.
Satellites have also been used to provide early warnings of crop failure. In Burkina Faso, Dalberg Data Insights’ team analyzed the color of cashew crops as they ripened to estimate yields. This gives governments and aid organizations more time to prepare for food shortages and put the necessary resources in place to combat them.
Finally, mobile applications often rely on remote GPS and Wifi data from the device to help users find the best route (e.g., driving directions in Google Maps) or nearest locations for a physical store. Both Apple and Android phones support access to this data, although the methods for accessing it differ by platform.
How to Find Spatial Data
There are several methods to locate spatial data sources. First, government agencies at various levels often provide publicly accessible repositories of geospatial data, such as the U.S. Geological Survey or national mapping agencies. Additionally, academic institutions and research organizations frequently share GIS datasets related to specific fields of study. Online data portals and clearinghouses like Data.gov, OpenStreetMap, and the Global Data Explorer offer a wealth of geospatial information.
Don’t forget to explore data provided by non-governmental organizations, commercial data providers, and crowdsourced platforms. Social media, forums, and GIS community websites are excellent places to connect with fellow geospatial enthusiasts who can point you in the right direction. Lastly, consider creating your spatial data through surveys, fieldwork, or GPS devices when the required data isn’t readily available. With these resources and a bit of research, you can locate the spatial data needed for your project.
GeoPostcodes maintains a worldwide database of postcodes, including up-to-date time zone information for every postcode-locality combination. When a postcode is linked to several time zones, you can access all of them and use locality to filter.
How to aggregate geographic data
Aggregating spatial data is a crucial process in Geographic Information Systems (GIS) that involves combining and summarizing geospatial information to gain insights at different geographic scales. To aggregate spatial data effectively, start by defining your objective and the level of detail required for analysis. Next, choose an appropriate aggregation unit, such as administrative boundaries, grid cells, or custom-defined regions, based on your research question and data availability. Then, apply aggregation functions, such as sum, average, count, or maximum, to the original data within each chosen unit. Finally, visualize and analyze the aggregated data to uncover spatial patterns, trends, or disparities.
Aggregating spatial data enables you to simplify complex datasets, make information more digestible, and derive valuable insights for various applications, from regional planning to resource management.
Spatial Analysis Tools
They are essential in Geographic Information Systems (GIS) for extracting meaningful insights from location data. Here are some of the main spatial analysis tools and their functions:
Buffer Analysis: Buffering creates zones around specific geographic features, helping analyze proximity or accessibility. For example, it can determine the areas within a certain distance from a school for planning bus routes.
Spatial Join: Spatial join combines attributes from two or more datasets based on their spatial relationships. It’s used to associate data, like linking census data to political boundaries, providing insights into demographics.
Interpolation: Interpolation methods estimate values at unmeasured locations within a dataset. This is commonly used in environmental sciences to predict values like temperature or pollution levels at unsampled locations.
Network Analysis: Network analysis tools find optimal routes or paths through a network, such as determining the quickest route for emergency services or delivery vehicles.
Density Mapping: Density mapping reveals the concentration of features within an area, useful for visualizing population distribution, crime hotspots, or resource availability.
Geostatistics: Geostatistical methods, like Kriging, model spatial variability and correlations, allowing for more accurate predictions and uncertainty assessment in spatial data.
Overlay Analysis: Overlay combines multiple spatial datasets to identify areas where they intersect or overlap. It’s used for tasks like land-use planning, where zoning regulations are overlaid on a map to determine suitability for development.
Proximity Analysis: Proximity analysis calculates distances or relationships between features, helping identify nearest neighbors or potential impacts, such as the distance between wells and contamination sources.
Spatial Clustering: Spatial clustering identifies patterns or groups of features that are spatially close, aiding in identifying disease clusters or retail store placement.
Terrain Analysis: Terrain analysis tools model and analyze the elevation and slope of the land, valuable in various applications, from flood risk assessment to landscape design.
These tools provide the means to explore, interpret, and make informed decisions based on location data, making them indispensable in fields ranging from urban planning to environmental management.
Conclusion
Spatial analysis is crucial in many business and software applications, and having accurate location data is often a foundational requirement. Bad location data can cause shippers to miss delivery estimates, companies to make bad property investments or insurers to make overly risky assessments.
The need for accurate location data is further complicated by the fact that location data is constantly changing. Postcodes and local municipalities are constantly in flux, and even countries change borders every year. While it might seem simple just to download a list of location names and coordinates, businesses that rely on accurate location data almost always use a trusted provider like GeoPostcodes for spatial analysis data.
In this piece, I explored some of the applications for spatial analysis and offered some examples of common techniques: mapping, GIS analysis, and remote sensing. While you can go much deeper into this topic, I hope this overview helps give you a sense of what’s possible and the importance of having accurate data to work with as you build your software applications.
What is an example of a spatial analysis?
An example of spatial analysis is determining the optimal location for a new retail store by analyzing customer demographics, competitor locations, and accessibility data within a city. This helps businesses make data-driven decisions on where to open a store for maximum profitability based on geographic factors.
What is spatial analysis in GIS?
Spatial analysis in GIS involves examining geographic data to uncover patterns, relationships, and insights tied to specific locations. It helps professionals make informed decisions by revealing how geographic factors influence various phenomena, from urban planning to environmental assessment.